Figure 1.
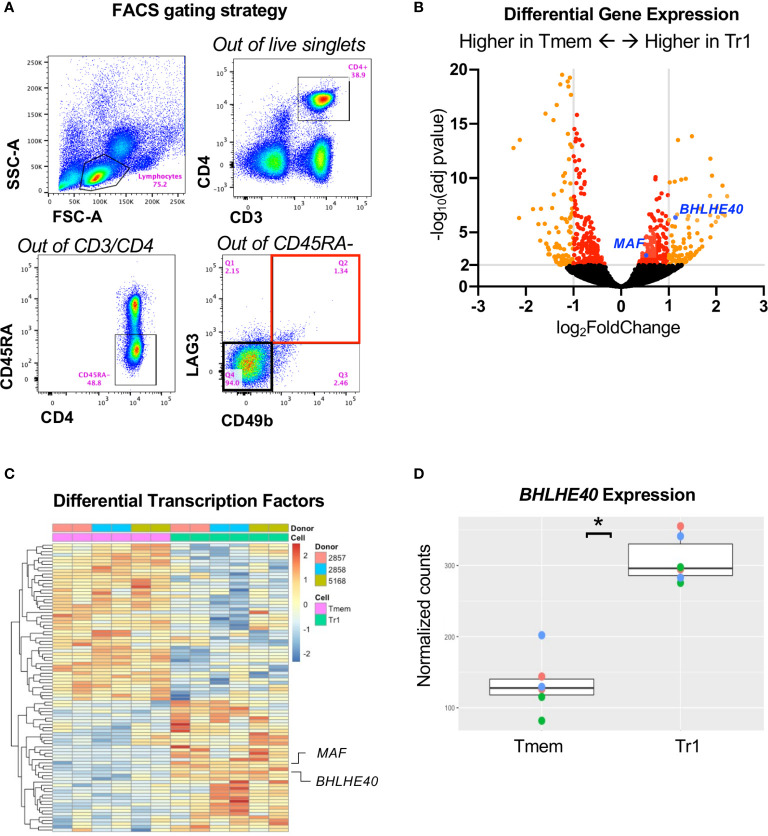
RNA sequencing identifies BHLHE40 in Tr1 cells. (A) Sorting strategy for ex vivo human Tr1 cells. Healthy donor PBMCs were gated for CD3+/CD4+/CD45RA-. Tr1 cells were additionally gated and sorted for LAG3+/CD49b+, indicated with a red bounding box, while non-Tr1 Tmem cells were sorted for LAG3-/CD49b-, indicated with a black bounding box. (B) Volcano plot of differentially expressed genes between Tr1 and non-Tr1 Tmem cells. Dots indicate individual genes, with genes having an adjusted p value < 0.05 indicated in red and with genes with also an abs(log2(fold change)) > 1 in orange. MAF (cMAF) and BHLHE40 are indicated with blue dots. (C) Differentially expressed transcription factors between Tr1 and non-Tr1 Tmem cells with an adjusted p value < 0.05 are plotted by rows and CD4+ T cell samples by columns. Fill color is z-scaled per gene. (D) Normalized counts (variance stabilized normalized counts) of BHLHE40 gene expression between Tr1 and non-Tr1 Tmem cells. *adjusted p value < 0.05 after Benjamini–Hochberg multiple testing correction. n = 3 healthy donors, biological duplicates for Tr1 and Tmem cells. Tmem, non-Tr1 T memory.

