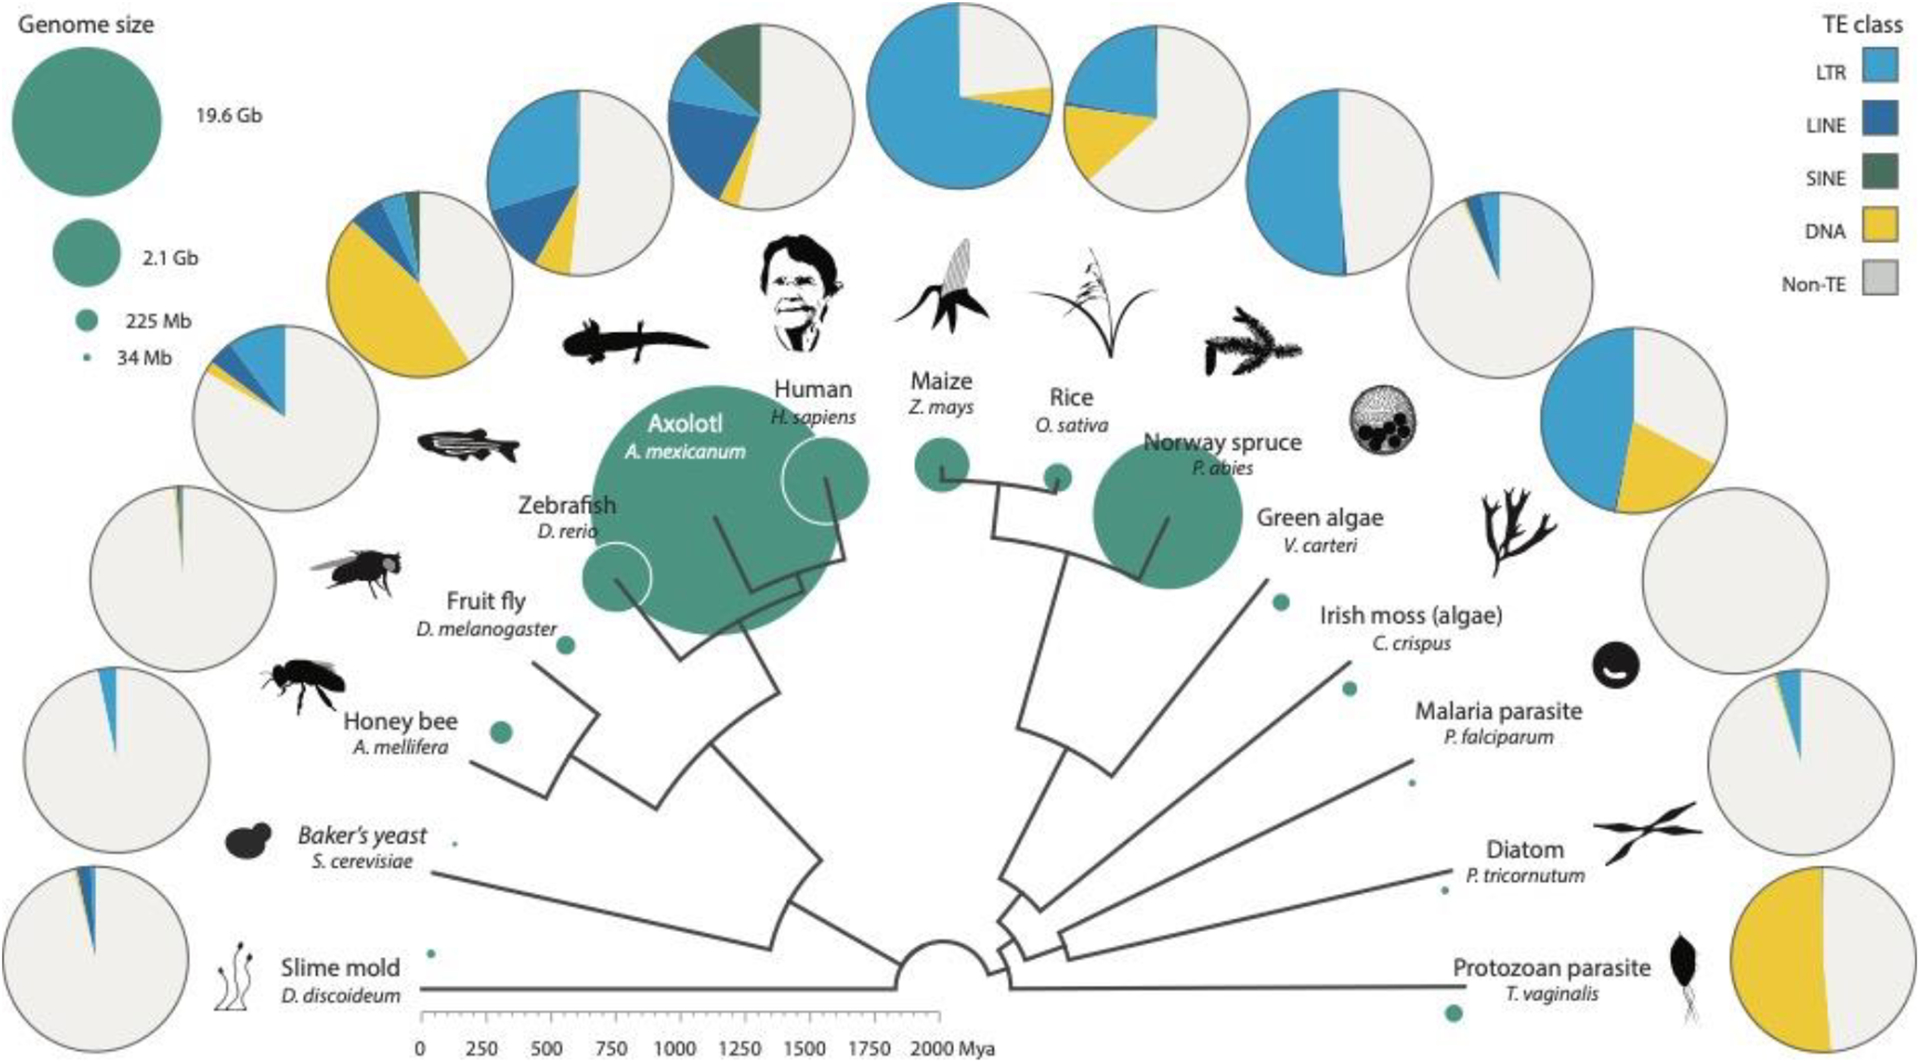
Figure 3. Distribution of TEs across the eukaryote phylogeny.

Reference genome size (sea green circles) varies dramatically across eukaryotes and is loosely correlated with transposable element content. Here, the honey bee TE content is likely an underestimate, as approximately 3% of the genome derives from unusual “large retrotransposon derivatives” (LARDs) (39). For ease of visualisation, DIRS elements have been included with LTRs and all Class II elements included under “DNA”. Data was acquired from genome RepeatMasker output files. Credit to Matt Crook for Volvox carteri silhouette and to Huang et al. for the figure inspiration (71).
