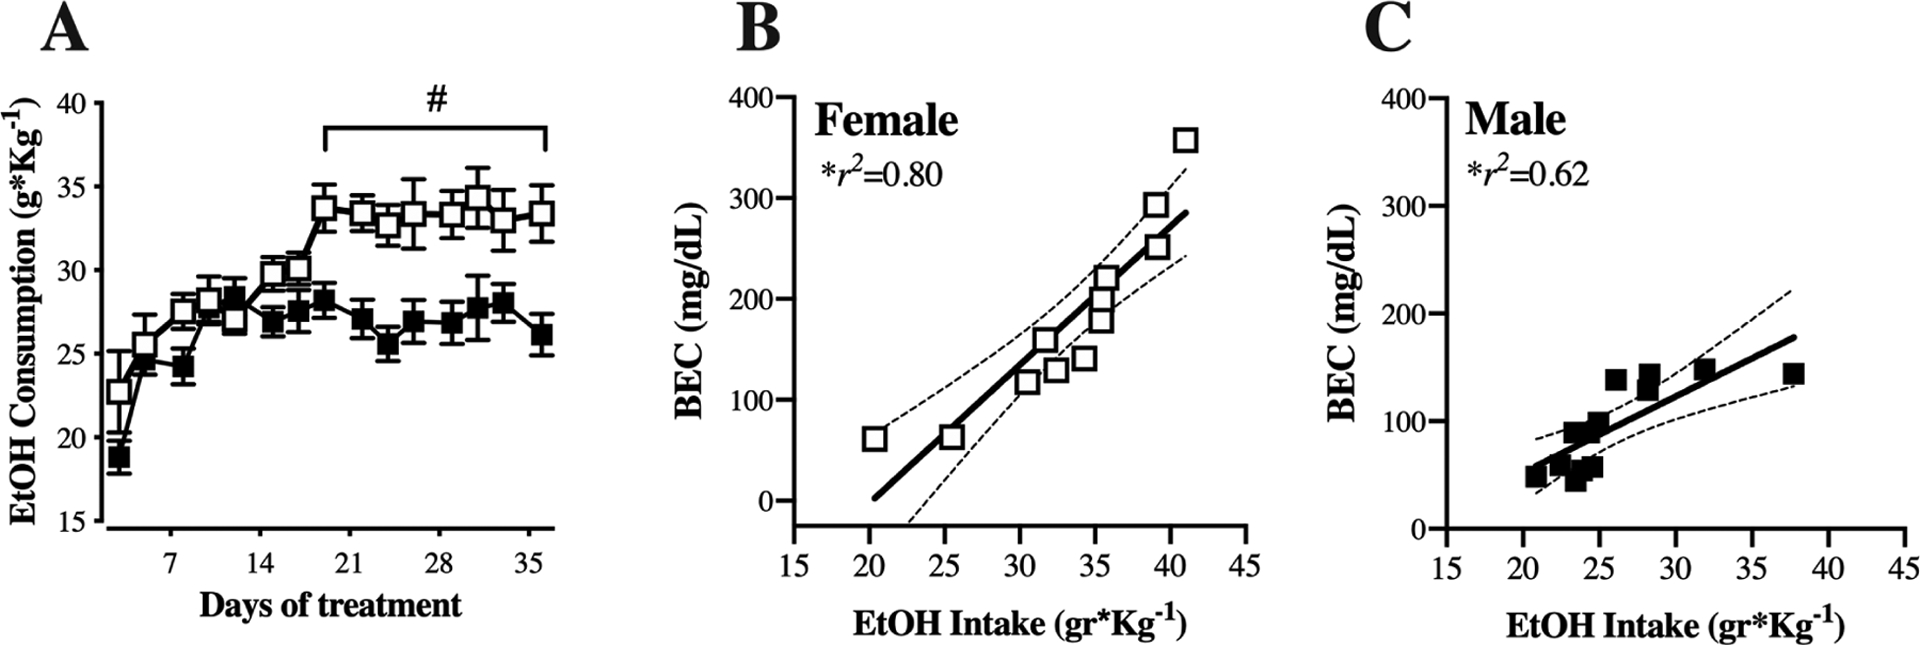
Figure 1. Females consume more alcohol and display greater blood ethanol levels than males.

(A) Male (black symbols) and female (white symbols) cHAP mice were provided two-bottle choice access to 10% (v/v) alcohol and water in the home cage for 5 weeks. Intake was measured and bottle position alternated 3 times per week. Data are presented as mean ± SEM weight-normalized alcohol intake, calculated as (g alcohol consumed)/(body weight in kg), averaged across 2 or 3 days. (B-C) Correlation between weight-normalized alcohol intake on the day prior to euthanasia and the blood ethanol content (BEC) obtained at the time of euthanasia for females (B) and males (C). # p<0.01, female vs. male. n=12 female, n=13 male.
