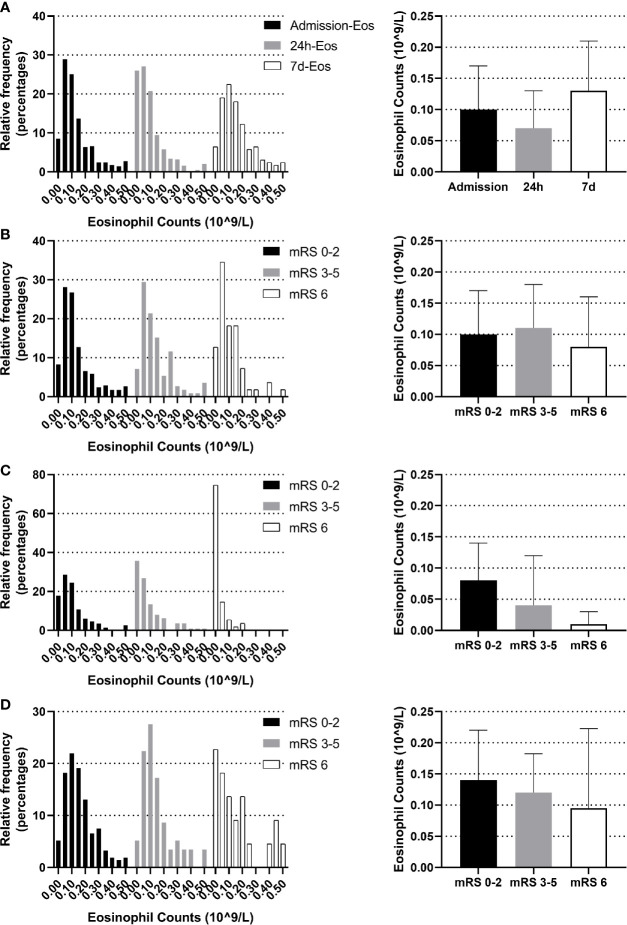
Figure 2.
Temporal profile of eosinophil in AIS patients treated with r-tPA intravenous thrombolysis (A) Temporal profile of eosinophil on admission, within 24 h after intravenous thrombolysis and the seventh day (B) Distribution of admission eosinophil according to 3-month mRS scores. (C) Distribution of 24 h-eosinophil according to 3-month mRS scores. (D) Distribution of 7 d-eosinophil according to 3-month mRS scores. Frequency distribution charts (eosinophil >0.5 were included in the group with bin center = 0.5) and bar graphs (median and interquartile range) were displayed.

