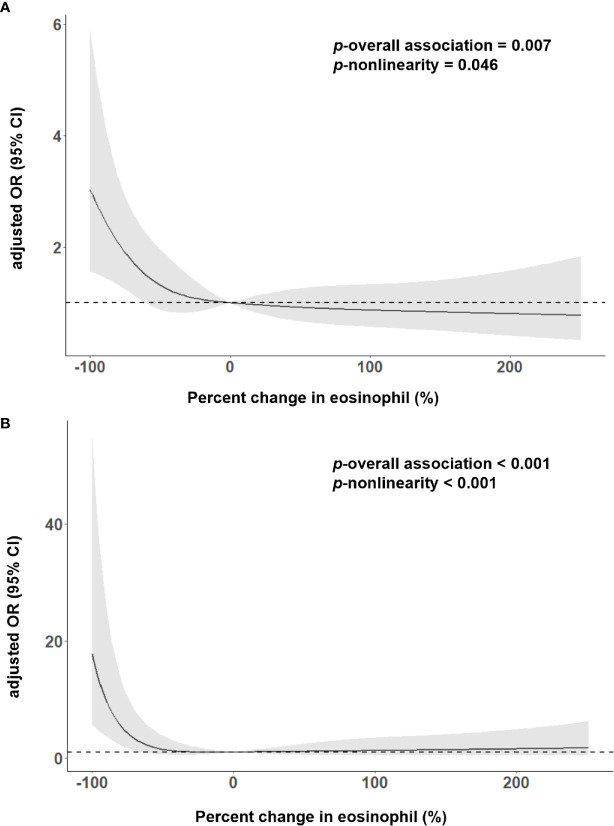
Figure 3.
Adjusted association of eosinophil changes after intravenous thrombolysis with (A) 3-month poor outcome; (B) death, using multiple spline regression analyses with four knots (at the fifth, 35th, 65th, and 95th percentiles). The solid line indicates odds ratio, while the shadow indicates 95% CI. Reference point was 0. Data were adjusted for age, sex, current smoking, history of hypertension, atrial fibrillation, stroke, triglycerides and admission NIHSS score.

