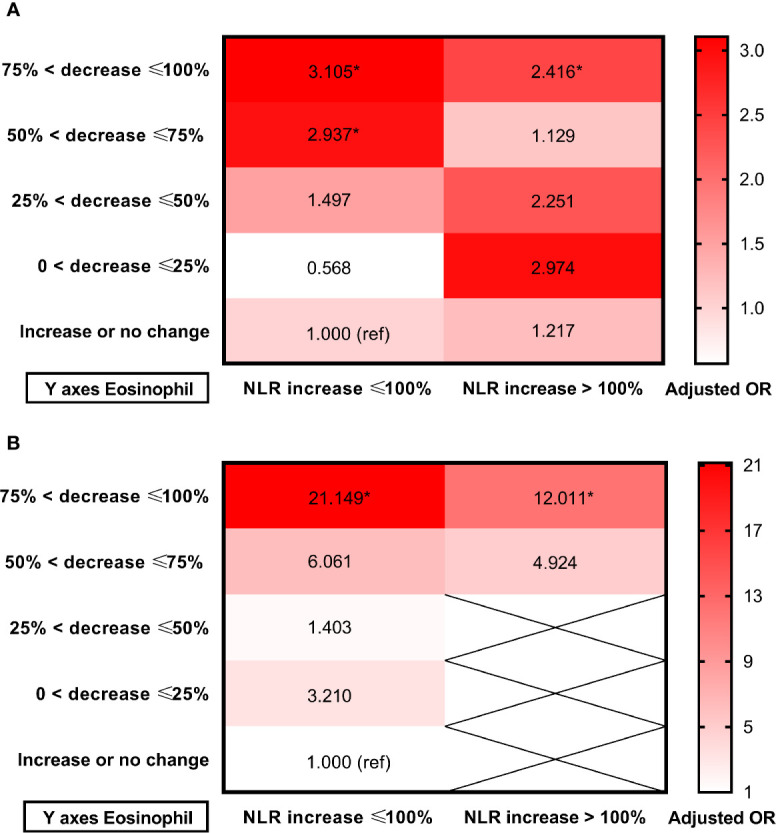
Figure 5.

Heat maps of adjusted odds ratios for (A) Poor outcome; (B) Death in the 10 groups established using eosinophil and NLR changes after intravenous thrombolysis. Data were adjusted for age, sex, current smoking, history of hypertension, atrial fibrillation, stroke, triglycerides and admission NIHSS score (model 3). Asterisk indicates p <0.05. Total patients and outcome events in each group could be found in the Supplementary Figure 2 .
