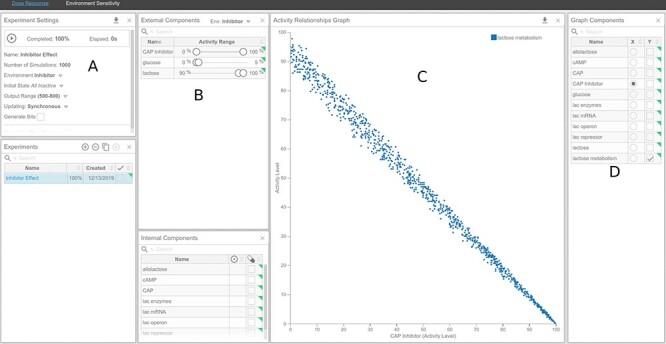
Figure 13 .

Dose–response curve of CAPInhibitor and its effect on lactose metabolism under high-lactose and low-glucose environments. (A) Experiment Settings panel. (B) External Components panel. (C) Activity Relationships panel. (D) Graph Components panel.
