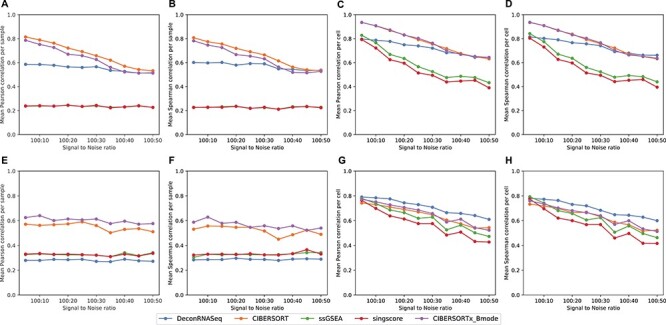
Figure 1 .

Results on simulation data with different SNR from 100:5 to 100:50. Note in A and B, the ssGSEA results align with SingScore. A–D: mean correlation between flow cytometry cell fractions and predicted cell fractions obtained from running methods with reduced LM22, across different noise levels. A: sample-level Pearson correlation, B: sample-level Spearman correlation, C: cell-level Pearson correlation, D: cell-level Spearman correlation. F–I: mean correlation between flow cytometry cell fractions and predicted cell fractions obtained from running methods with LM6, across different noise levels. F: sample-level Pearson correlation, G: sample-level Spearman correlation, H: cell-level Pearson correlation, I: cell-level Spearman correlation.
