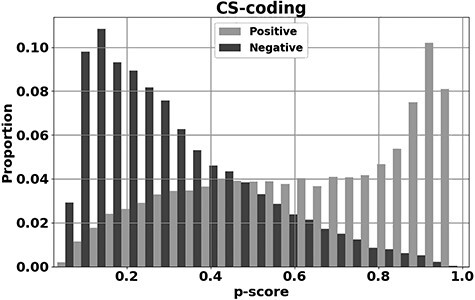
Figure 1 .

y-axis: the proportions for correct prediction of disease-drivers (positives, light gray) and neutrals (negatives, dark gray) against P-score (x-axis: the confidence an SNV is a driver), evaluated on unseen test data. These predictions are for SNVs in coding regions of the human cancer genome and the methodology behind this plot is more fully described in Rogers et al. [42].
