
Figure 2 .
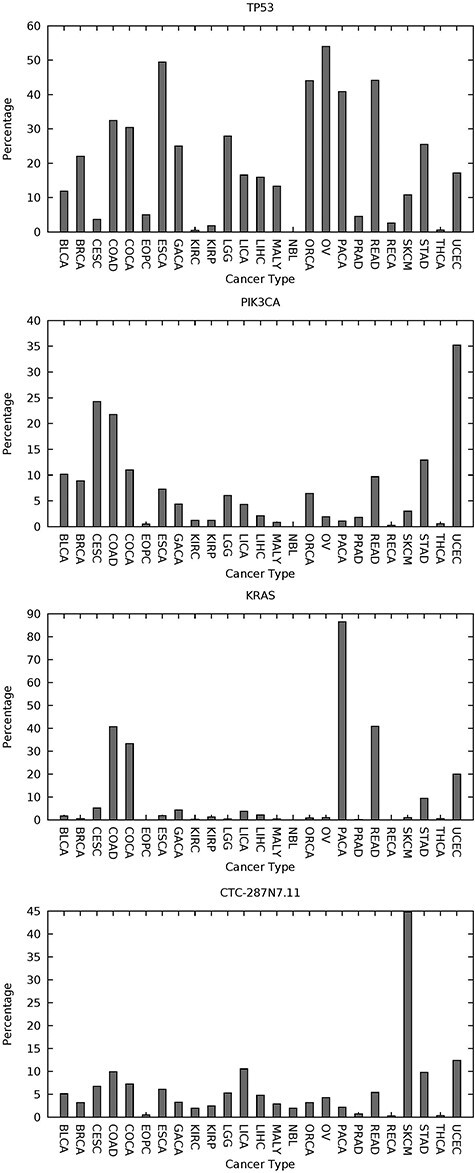
Four well-known cancer genes which can be labeled common drivers due to a higher incidence of predicted embedded SNV-drivers and an influence across multiple cancers. The y-axis gives the percentage incidence of at least one predicted high-confidence embedded SNV-driver (from use of CScape and using an FDR of 5%). The x-axis gives the typecodes of the 25 cancer types considered. These typecodes are matched with cancer name in supplementary table 1 of [55]. The figures for TP53 and KRAS are reproduced from [55] under the Creative Commons License [64].