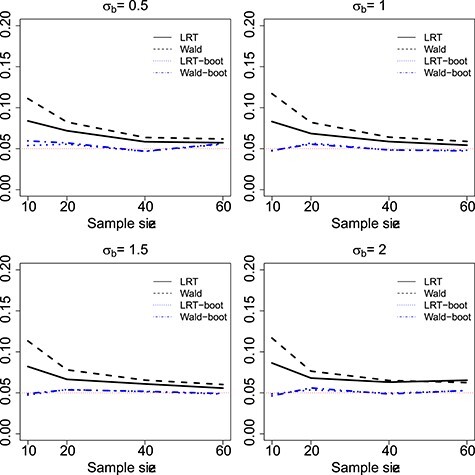
Figure 1 .

Type I error rate of LRT and Wald statistics when using the asymptotic  (black lines) and their corresponding bootsrap-based null distribution (blue lines) for testing
  versus
  or
or  . Each panel corresponds to a different size of the serial correlation captured by the random effects standard deviation
  .
.
