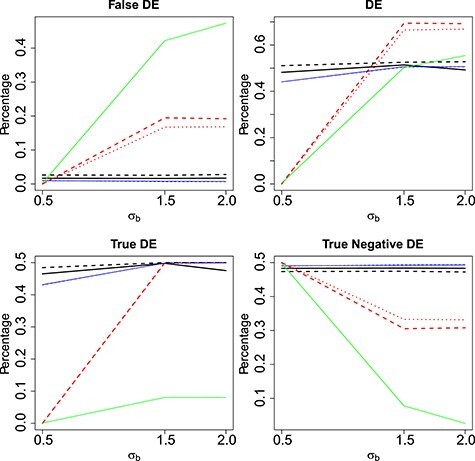
Figure 2 .

Mean proportion false discoveries of LRT and Wald statistics when using the asymptotic  (black) and their corresponding bootstrap-based null distribution (blue) for testing
  versus
  or
or  . We have also compared with the F-test statistic in limma-voom approach (green) and LRT and
  -test statistic in edgeR (red). Each panel corresponds to proportion false discoveries (top left), proportion discoveries (top right), proportion true discoveries (bottom left) and proportion true negative discoveries (bottom right).
