
Figure 7 .
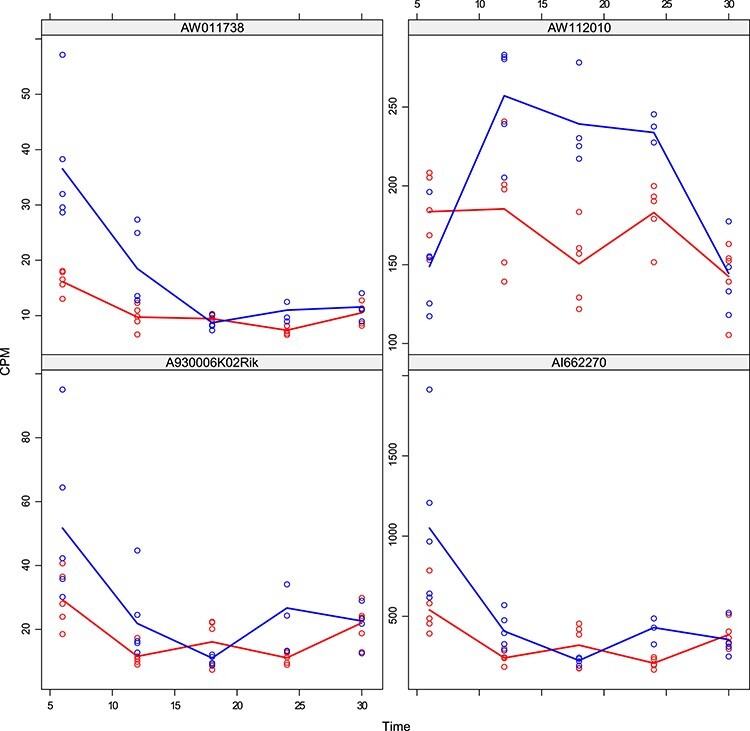
DMD mice experiment analysis: Histogram of the estimated random effects standard deviations for the genes detected by the Negative Binomial mixed model and not by the limma-voom.
Official websites use .gov
A
.gov website belongs to an official
government organization in the United States.
Secure .gov websites use HTTPS
A lock (
) or https:// means you've safely
connected to the .gov website. Share sensitive
information only on official, secure websites.
DMD mice experiment analysis: Histogram of the estimated random effects standard deviations for the genes detected by the Negative Binomial mixed model and not by the limma-voom.