Figure 3.

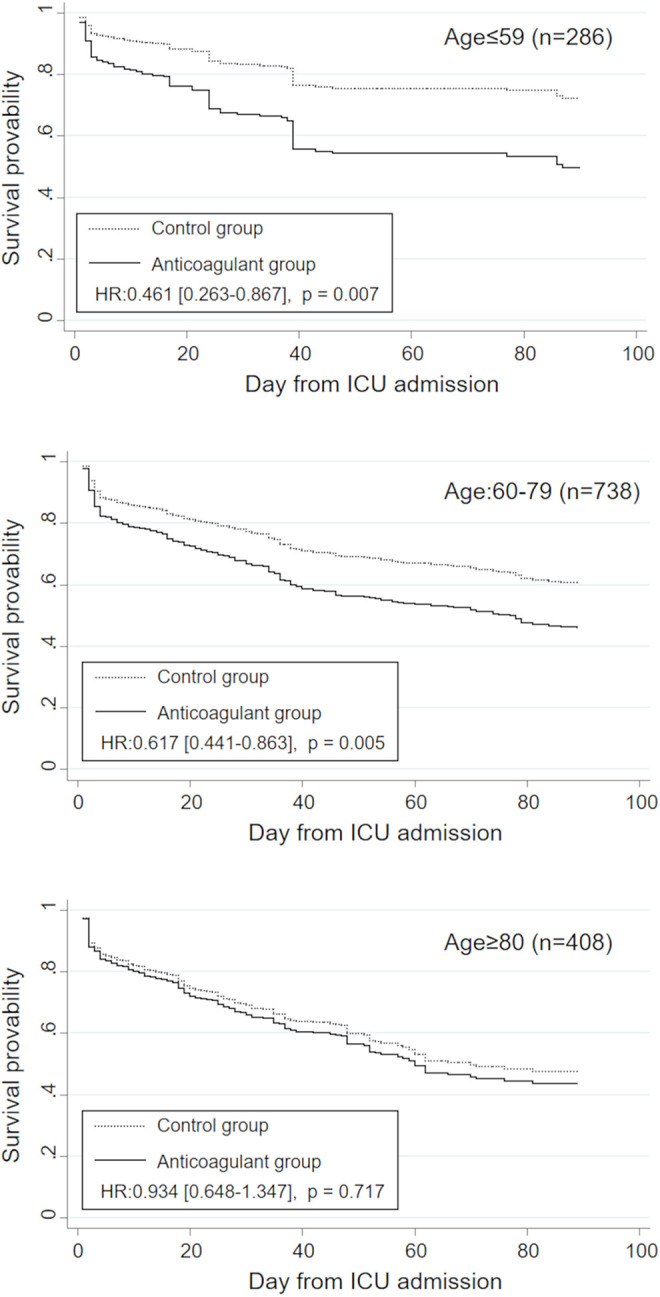
Adjusted estimated survival curves in the anticoagulant and control groups stratified by age class (age ≤ 60, 60-79, and ≥ 80 years). HR indicates hazard ratio.

Adjusted estimated survival curves in the anticoagulant and control groups stratified by age class (age ≤ 60, 60-79, and ≥ 80 years). HR indicates hazard ratio.