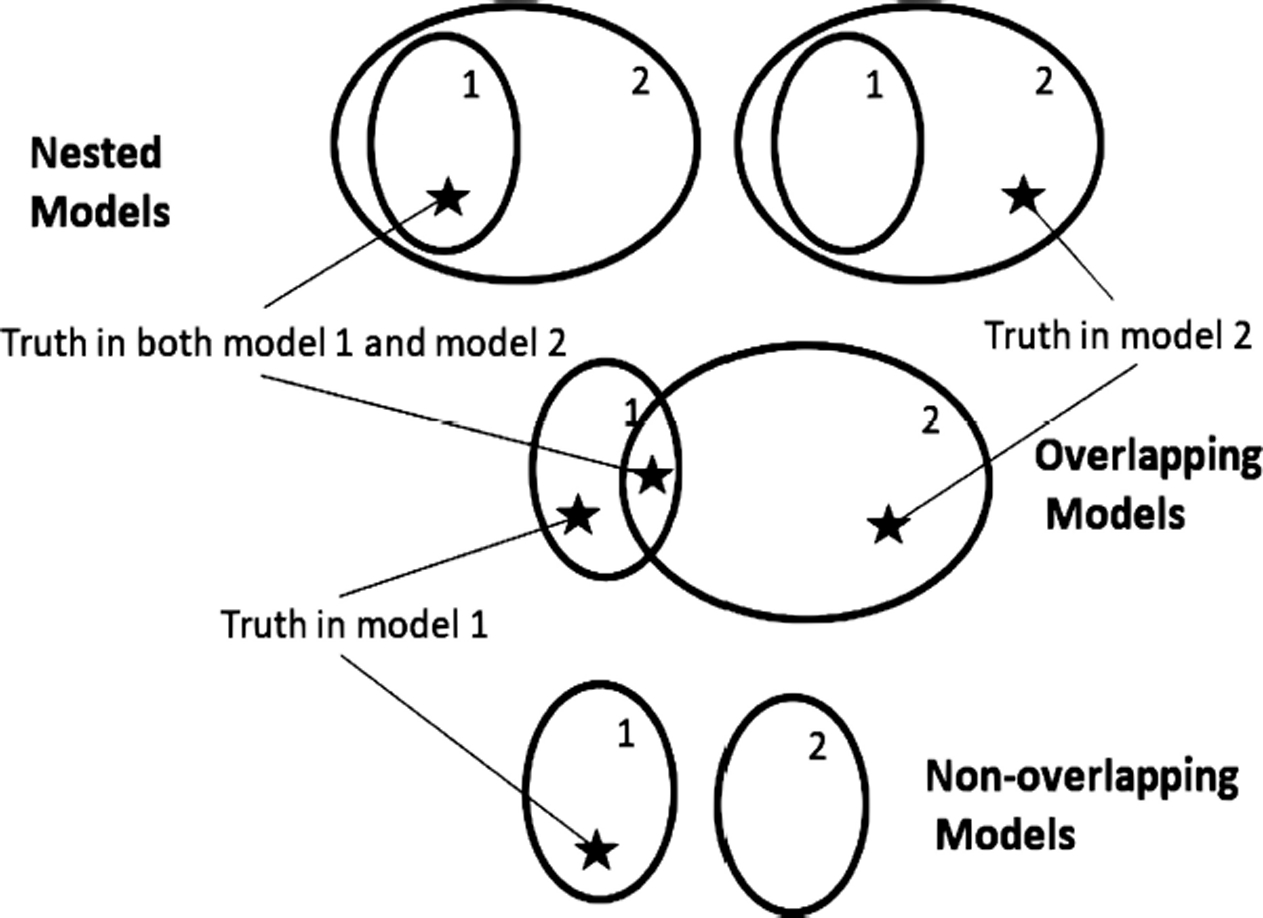
FIGURE 1 |.

Model topologies when models are correctly specified. Regions represent parameter spaces. Star represents the true parameter value corresponding to the model that generated the data. Top: a nested configuration would occur, for example, in the case of two regression models if the first model had predictor variables R1 and R2 while the second had predictor variables R1, R2, and R3. Middle: an overlapping configuration would occur if the first model had predictor variables R1 and R2 while the second had predictor variables R2 and R3. Three locations of truth are possible: truth in model 1, truth in model 2, and truth in both models 1 and 2. Bottom: an example of a non-overlapping configuration is when the first model has predictor variables R1 and R2 while the second model has predictor variables R3 and R4.
