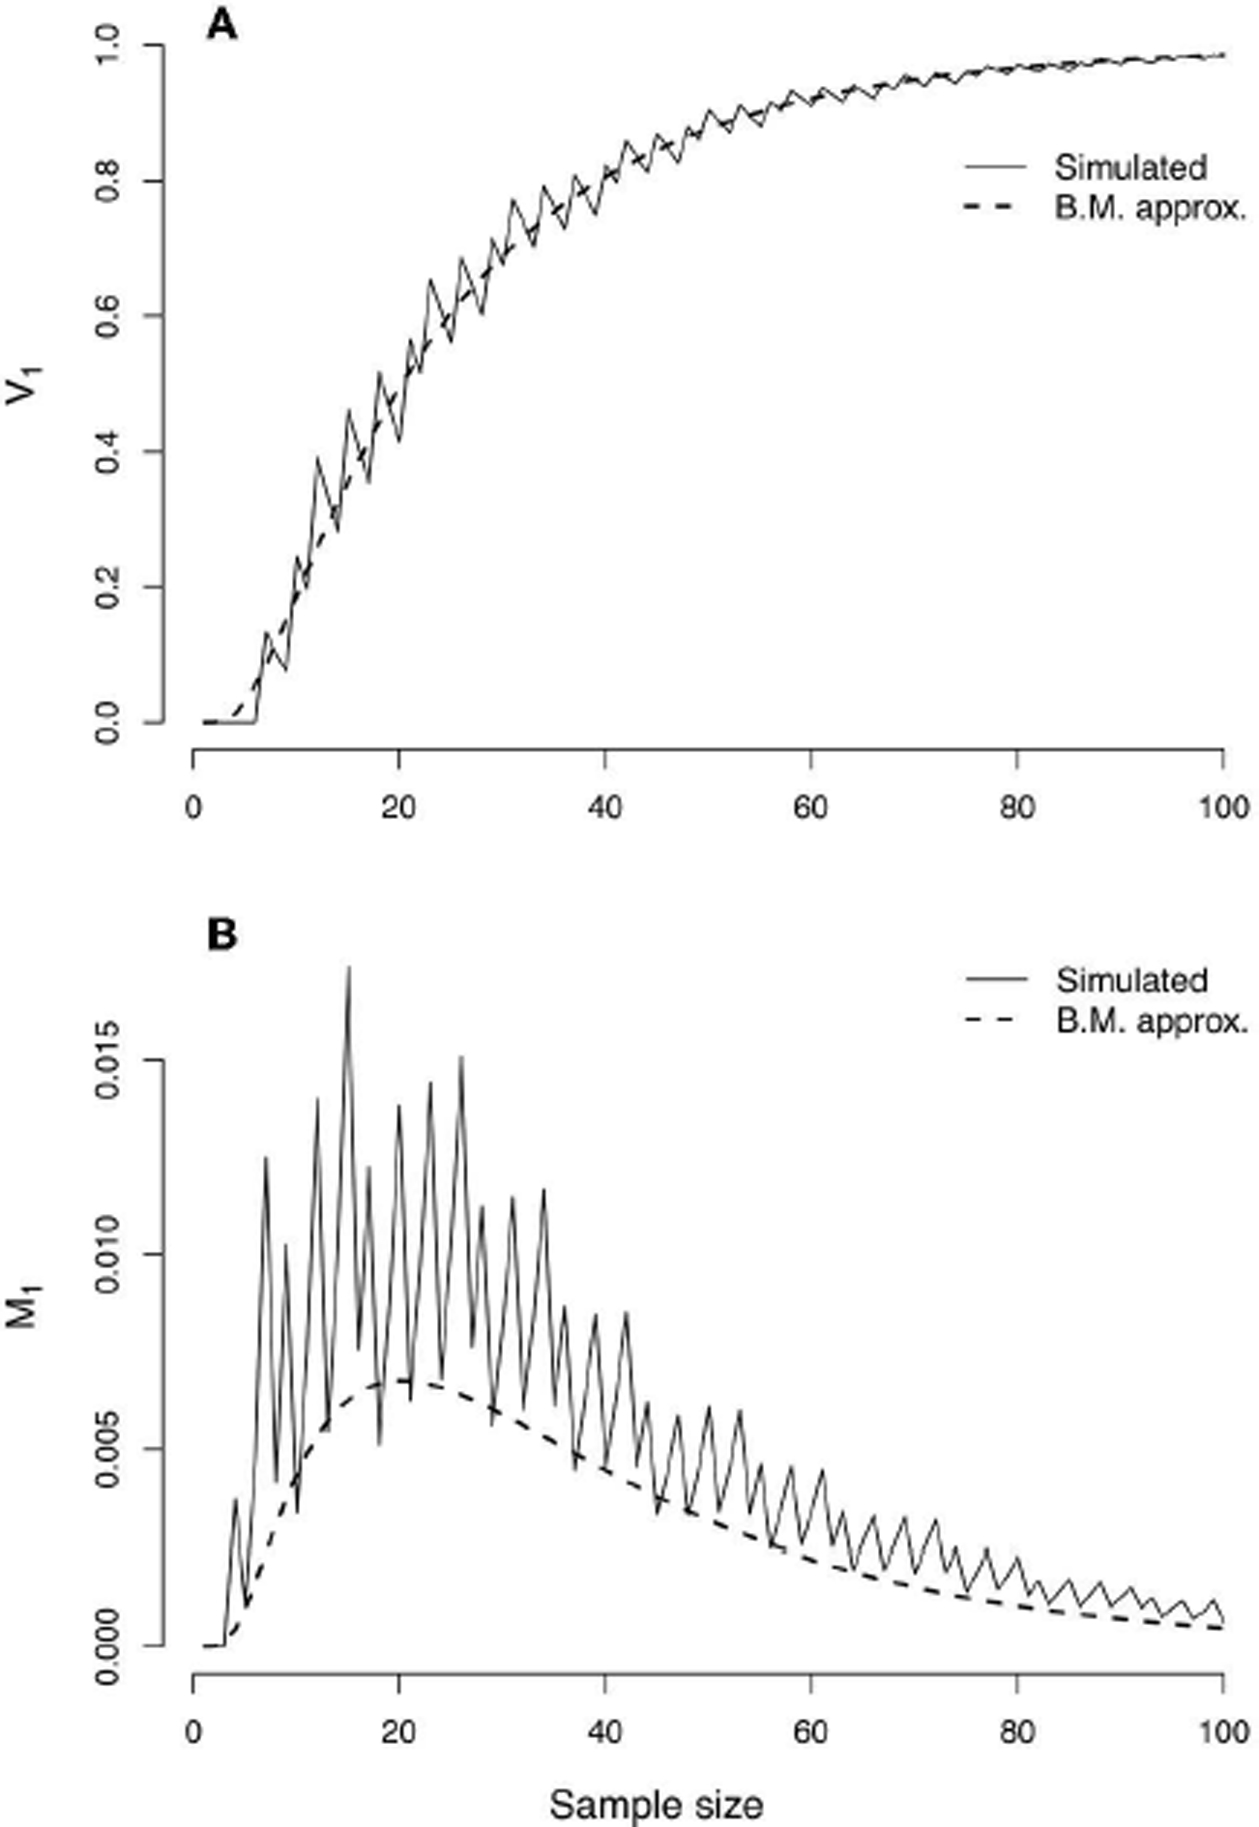
FIGURE 3 |.

Evidence error probabilities for comparing two Bernoulli(p) distributions, with p1 = 0.75 and p2 = 0.50. (A) Simulated values (jagged curve) and values approximated under the Central Limit Theorem of the probability of strong evidence for model H1, V1 = 1 − M1 − W1. (B) Simulated values (jagged curve) and approximated values for the probability of misleading evidence M1. Note that the scale of the bottom graph is one fifth of that of the top graph.
