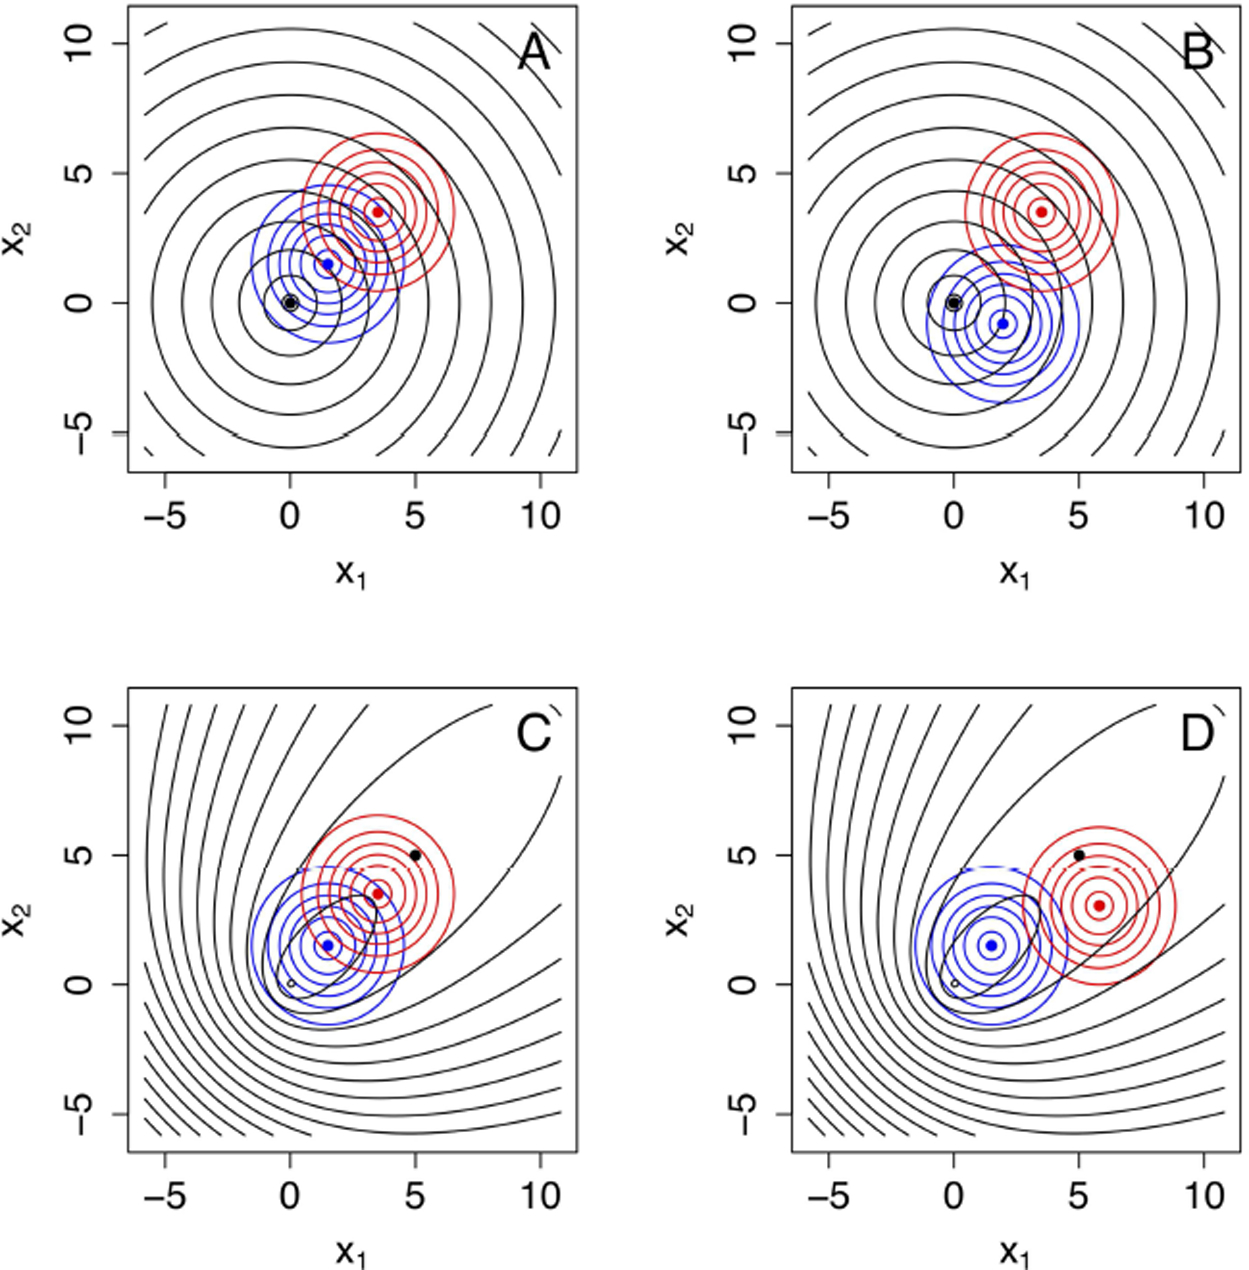
FIGURE 4 |.

Four model configurations involving a bivariate generating process g(x1, x2) (in black), and two approximating models f1(x1, x2) (in blue) and f2(x1, x2) (in red). In all cases the approximating models are bivariate normal distributions whereas the generating process is a bivariate Laplace distribution. These model configurations are useful to explore changes in α′ (Equation 53), β′ (Equation 59) and (Equations 71, 72) as a function of sample size, as plotted in Figure 6. (A) g(x1, x2) is a bivariate Laplace distribution centered at 0 with high variance. All three models have means aligned along the 1: 1 line and marked with a black, blue, and red filled circle, respectively. Model f1(x1, x2) is closest to the generating process. (B) Model f1(x1, x2) is still the model closest to the generating process, at exactly the same distance as in (A) but misaligned from the 1: 1 line. (C) Here all three models are again aligned, but the generating process g(x1, x2) is an asymmetric bivariate Laplace that has a large mode at 0, 0 and smaller mode around the mean, marked with a black dot. In this case, the generating model is closer to model f2(x1, x2) (in red). (D) Same as in (C), except model f2(x1, x2) (in blue) is now misaligned, but still the closest model to the generating process.
