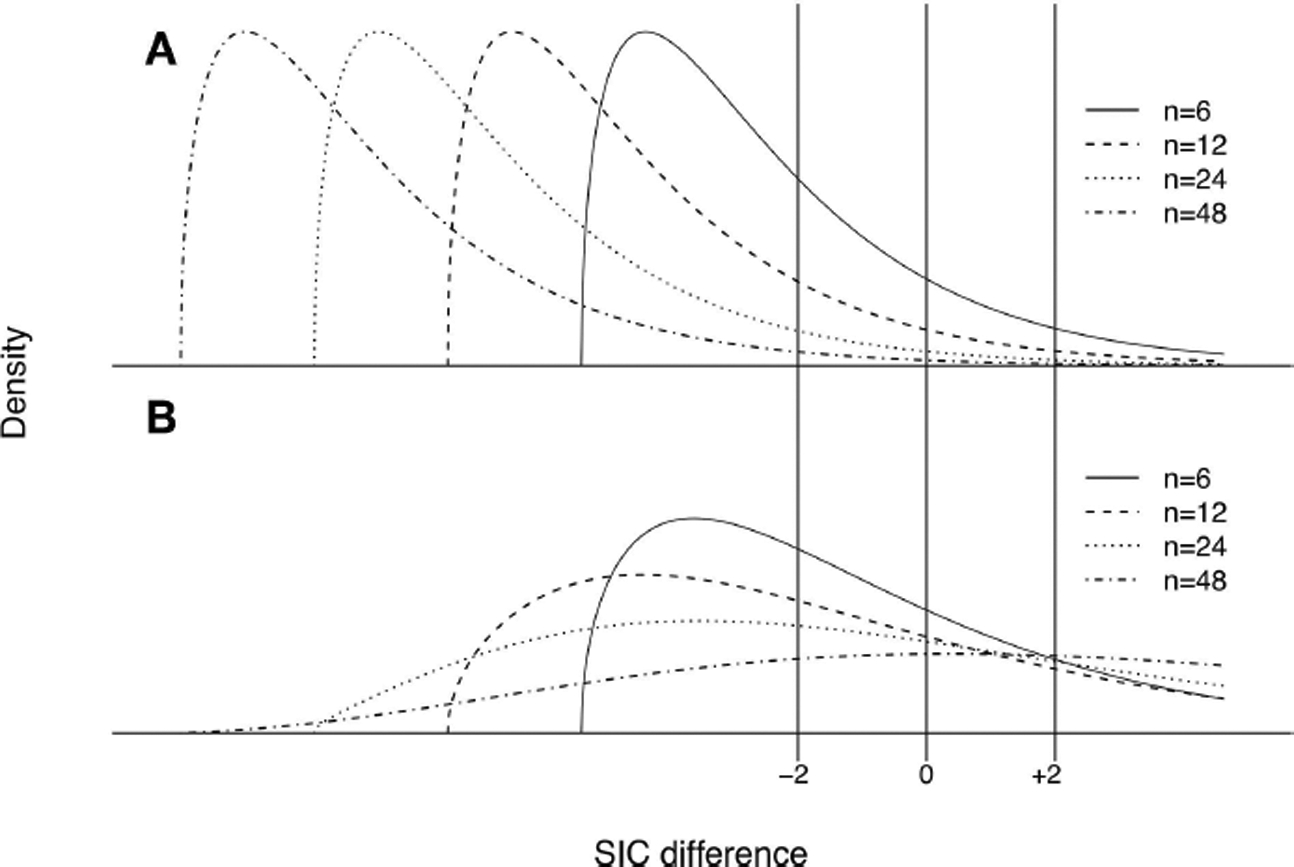
FIGURE 9 |.

(A) Chisquare distribution of the difference of SIC values, when data arise from model 1 nested within model 2. The chisquare distribution is shifted left as sample size increases. (B) Non-central chisquare distribution of the difference of SIC values, when data arise from model 2 (but not model 1), plotted for increasing sample sizes.
