
Fig. 4: fXai and fIIai treatment does not induce myocardial inflammation but differentially regulate gene expression and epigenetic marks in healthy mice.
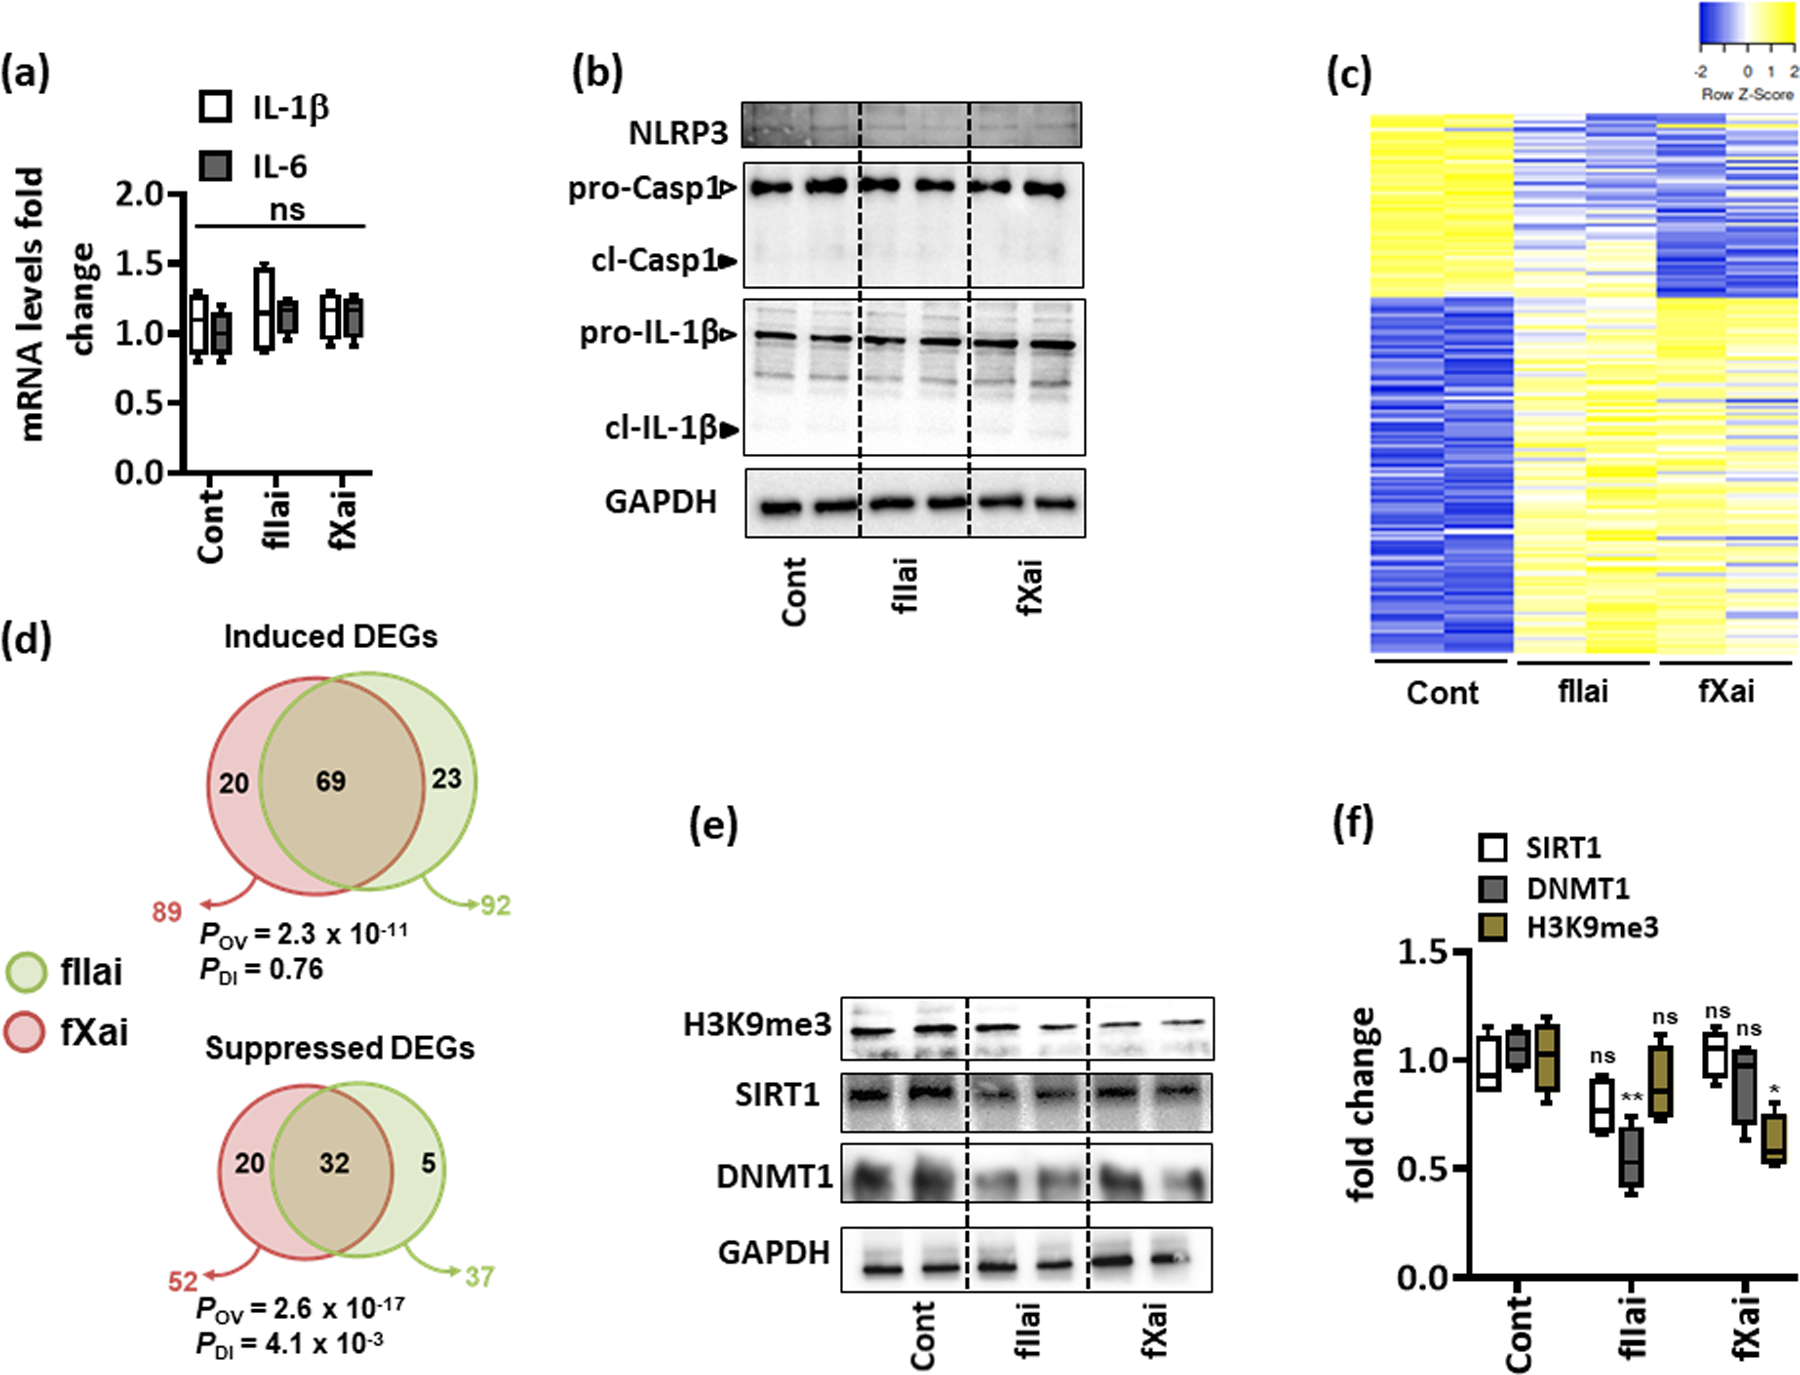
a: mRNA expression (qRT-PCR) of interleukin-6 (IL-6) and IL-1β was not altered in fIIai- and fXai-treated mice as compared to controls; box-plots summarizing data; GAPDH was used for normalization.
b: Representative immunoblots reflecting cardiac NLRP3 expression and total and cleaved forms of caspase-1 (pro-Casp1 and cl-Casp1) and IL-1β (pro-IL-1β and cl-IL-1β); loading control: GAPDH (d); arrowheads indicate inactive (white arrowheads) and active (black arrowheads) forms of caspase-1 or IL-1β.
c,d: Heat map (c) and Venn diagrams (d) summarizing differential gene-expression identified by RNA-seq. Gene count values larger than the average are represented in yellow, while lower counts than the average are represented in blue. Whenever transcript values are close to the average value, samples are colored in white (c). Venn diagram (d) showing overlap of genes significantly changed (induction, top or repression, bottom) in fIIai- or fXai-treated mice in relation to gene-expression in control (untreated) mice. The overlap of genes commonly regulated by fIIai or fXai was significant (POV, hypergeometric testing). The number of genes exclusively regulated by either fIIai or fXai was significant for downregulated genes (PDI, exact binomial test).
e,f: Representative immunoblots showing cardiac levels of H3K9me3, DNMT1, and SIRT1 after one-week treatment with fIIai or fXai compared to control; representative immunoblots (e) and box-blots summarizing results (f); GAPDH was used as loading control.
Mice without (Cont) or with fXai or with fIIai pretreatment. a: n=6; c: n=2; f: n=5 for each group; *P<0.05,**P<0.01, ns: non-significant (compared to Cont), a, f: ANOVA, comparing control to other groups).