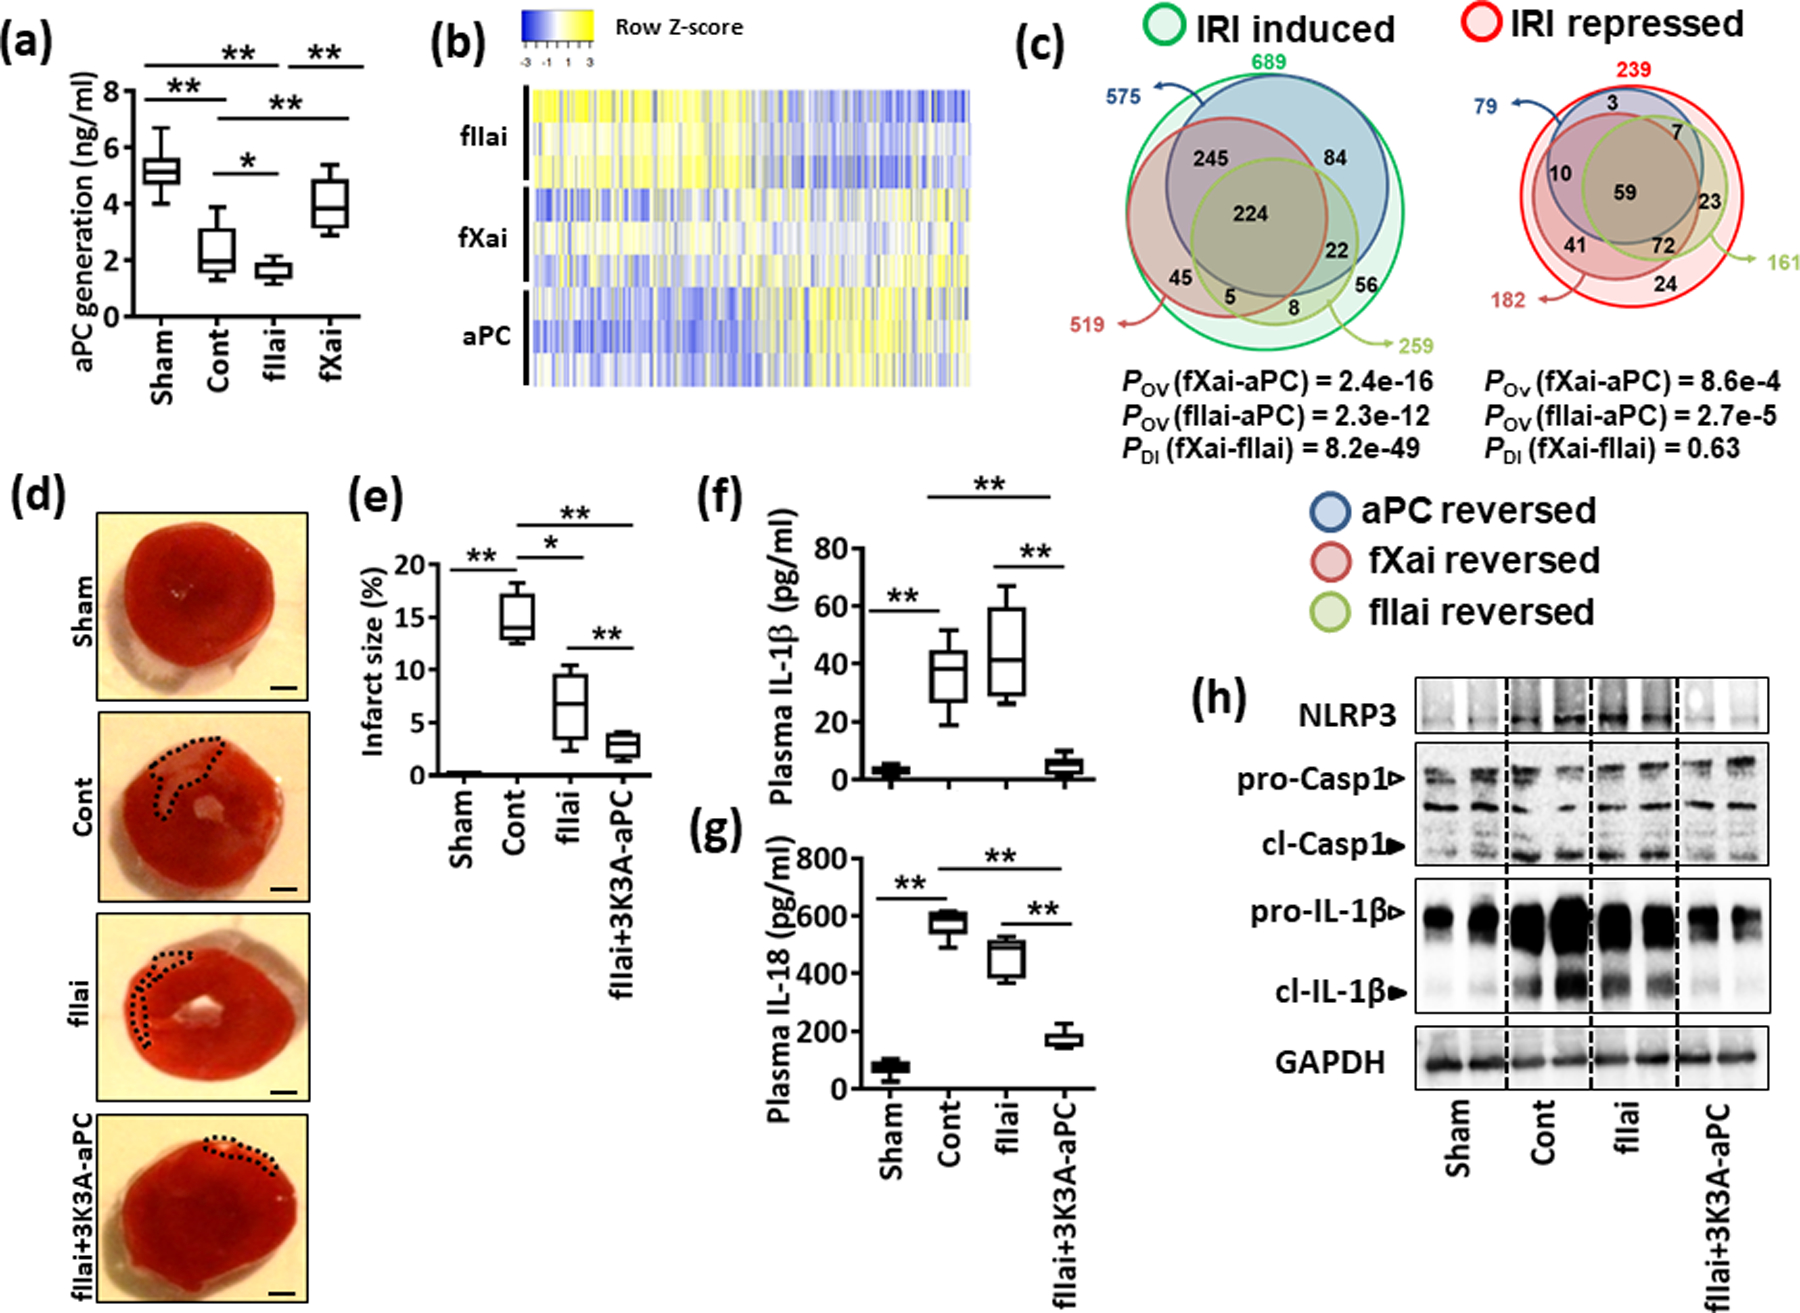
Fig. 5: fIIai-treatment is associated with lower aPC levels in myocardial IRI.

a: Plasma levels of aPC upon myocardial IRI in control and fIIai or fXai pretreated mice. fIIai but not fXai decreases aPC generation following myocardial IRI. Box-plot summarizing results.
b,c: Heat map (b) and Venn diagrams (c) summarizing differential gene-expression identified by RNA-seq. Gene count values larger than the average are represented in yellow, while lower counts than the average are represented in blue. Whenever transcript values are close to the average value, samples are colored in white (b). Venn diagrams (c) showing overlap of genes significantly changed (induction or repression) in fIIai, fXai, or aPC-treated mice, in relation to gene-expression in control-IRI mice. The overlap of genes regulated together by aPC and either fIIai or fXai was significant (POV, hypergeometric testing). The number of IRI-induced genes targeted by aPC and exclusively fXai was larger than that of genes regulated by aPC and exclusively fIIai (PDI, exact binomial test).
d-h: Concomitant treatment of fIIai and 3K3A-aPC reduces infarct size and the myocardial inflammatory response. Representative heart sections showing infarcted area detected by TTC staining (d, black doted encircled area, size bar: 20 μm) and box-plot summarizing data (e). Box-plots summarizing plasma levels of IL-1β (f) and IL-18 (g). Representative immunoblots showing cardiac NLRP3 expression and cleaved caspase- 1 (cl-Casp1) and cleaved IL-1β (cl-IL-1β); loading control: GAPDH (h). Arrowheads indicate inactive (white arrowheads) and active (black arrowheads) form of caspase-1 or IL-1β. Mice without (Cont) or with fIIai pretreatment alone (fIIai) or 3K3A-aPC on the top fIIai pretreatment (fIIai+3K3A-aPC). a: n=8; b: n=3; e: n=7; f, g: n=10 for each group; *P<0.05, **P<0.01 (a, e-g,: ANOVA).
