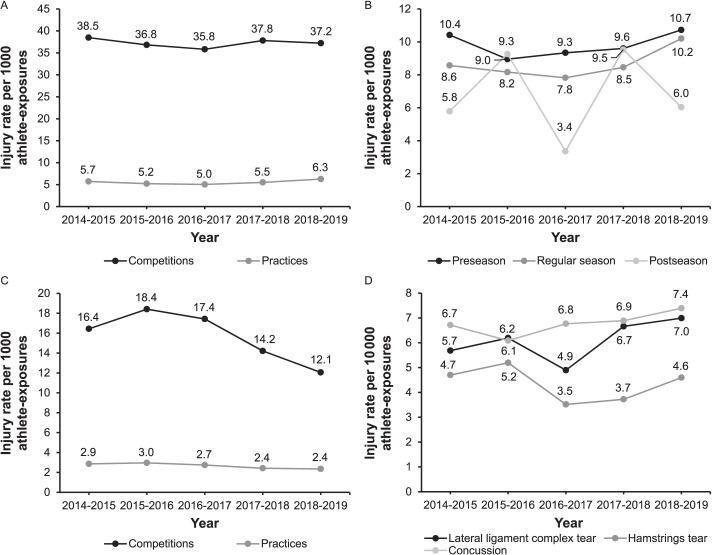
Figure.
Temporal patterns in injury rates between 2014–2015 and 2018–2019. A, Overall injury rates (per 1000 athlete-exposures [AEs]) stratified by event type (practices, competitions). B, Injury rates (per 1000 AEs) stratified by season segment. C, Rates of time-loss injuries (per 1000 AEs) stratified by event type (practices, competitions). D, Rates (per 10 000 AEs) of most commonly reported injuries. Rates presented in all figures are unweighted and based on reported data.

