Figure 4.
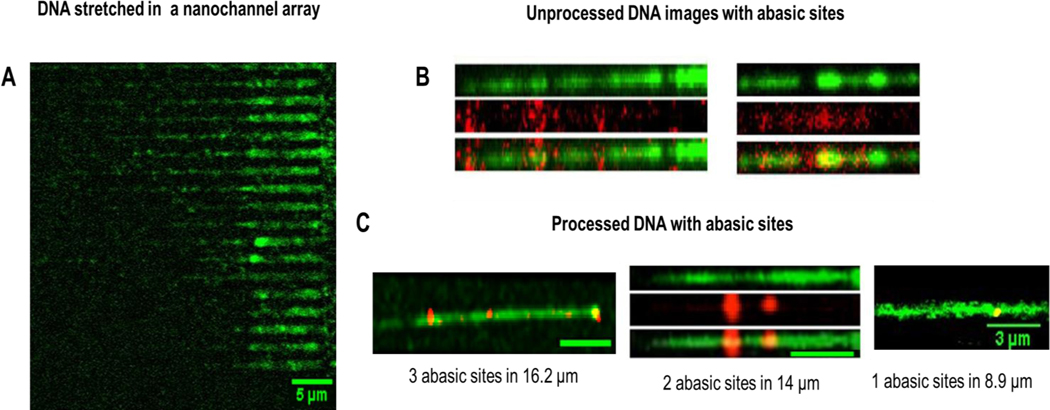
Images of λ-DNA confined in 100 nm × 80 nm stretching nanochannels. (A) Raw images of λ-DNAs’ backbones labeled with YOYO-1 intercalating dye (green) in the multi-structured device having 20 stretching nanochannels. (B) Examples of unprocessed raw images, where the AP sites were labeled with Alexa Fluor 647 streptavidin (red) with AP sites identified within the dsDNA molecules. (C) Processed composite image showing the AP sites co-localized in the DNA strand (yellow). Three specific strands are shown, 1 AP site was identified in 8.9 μm strand, 2 AP sites were identified in a 14 μm length strand and 3 AP sites were identified in a 16.2 μm length DNA strand. The images were processed in Fiji and images of DNA and the AP sites were imaged separately and merged. A scale bar of 5 μm is represented in the images unless otherwise indicated.

