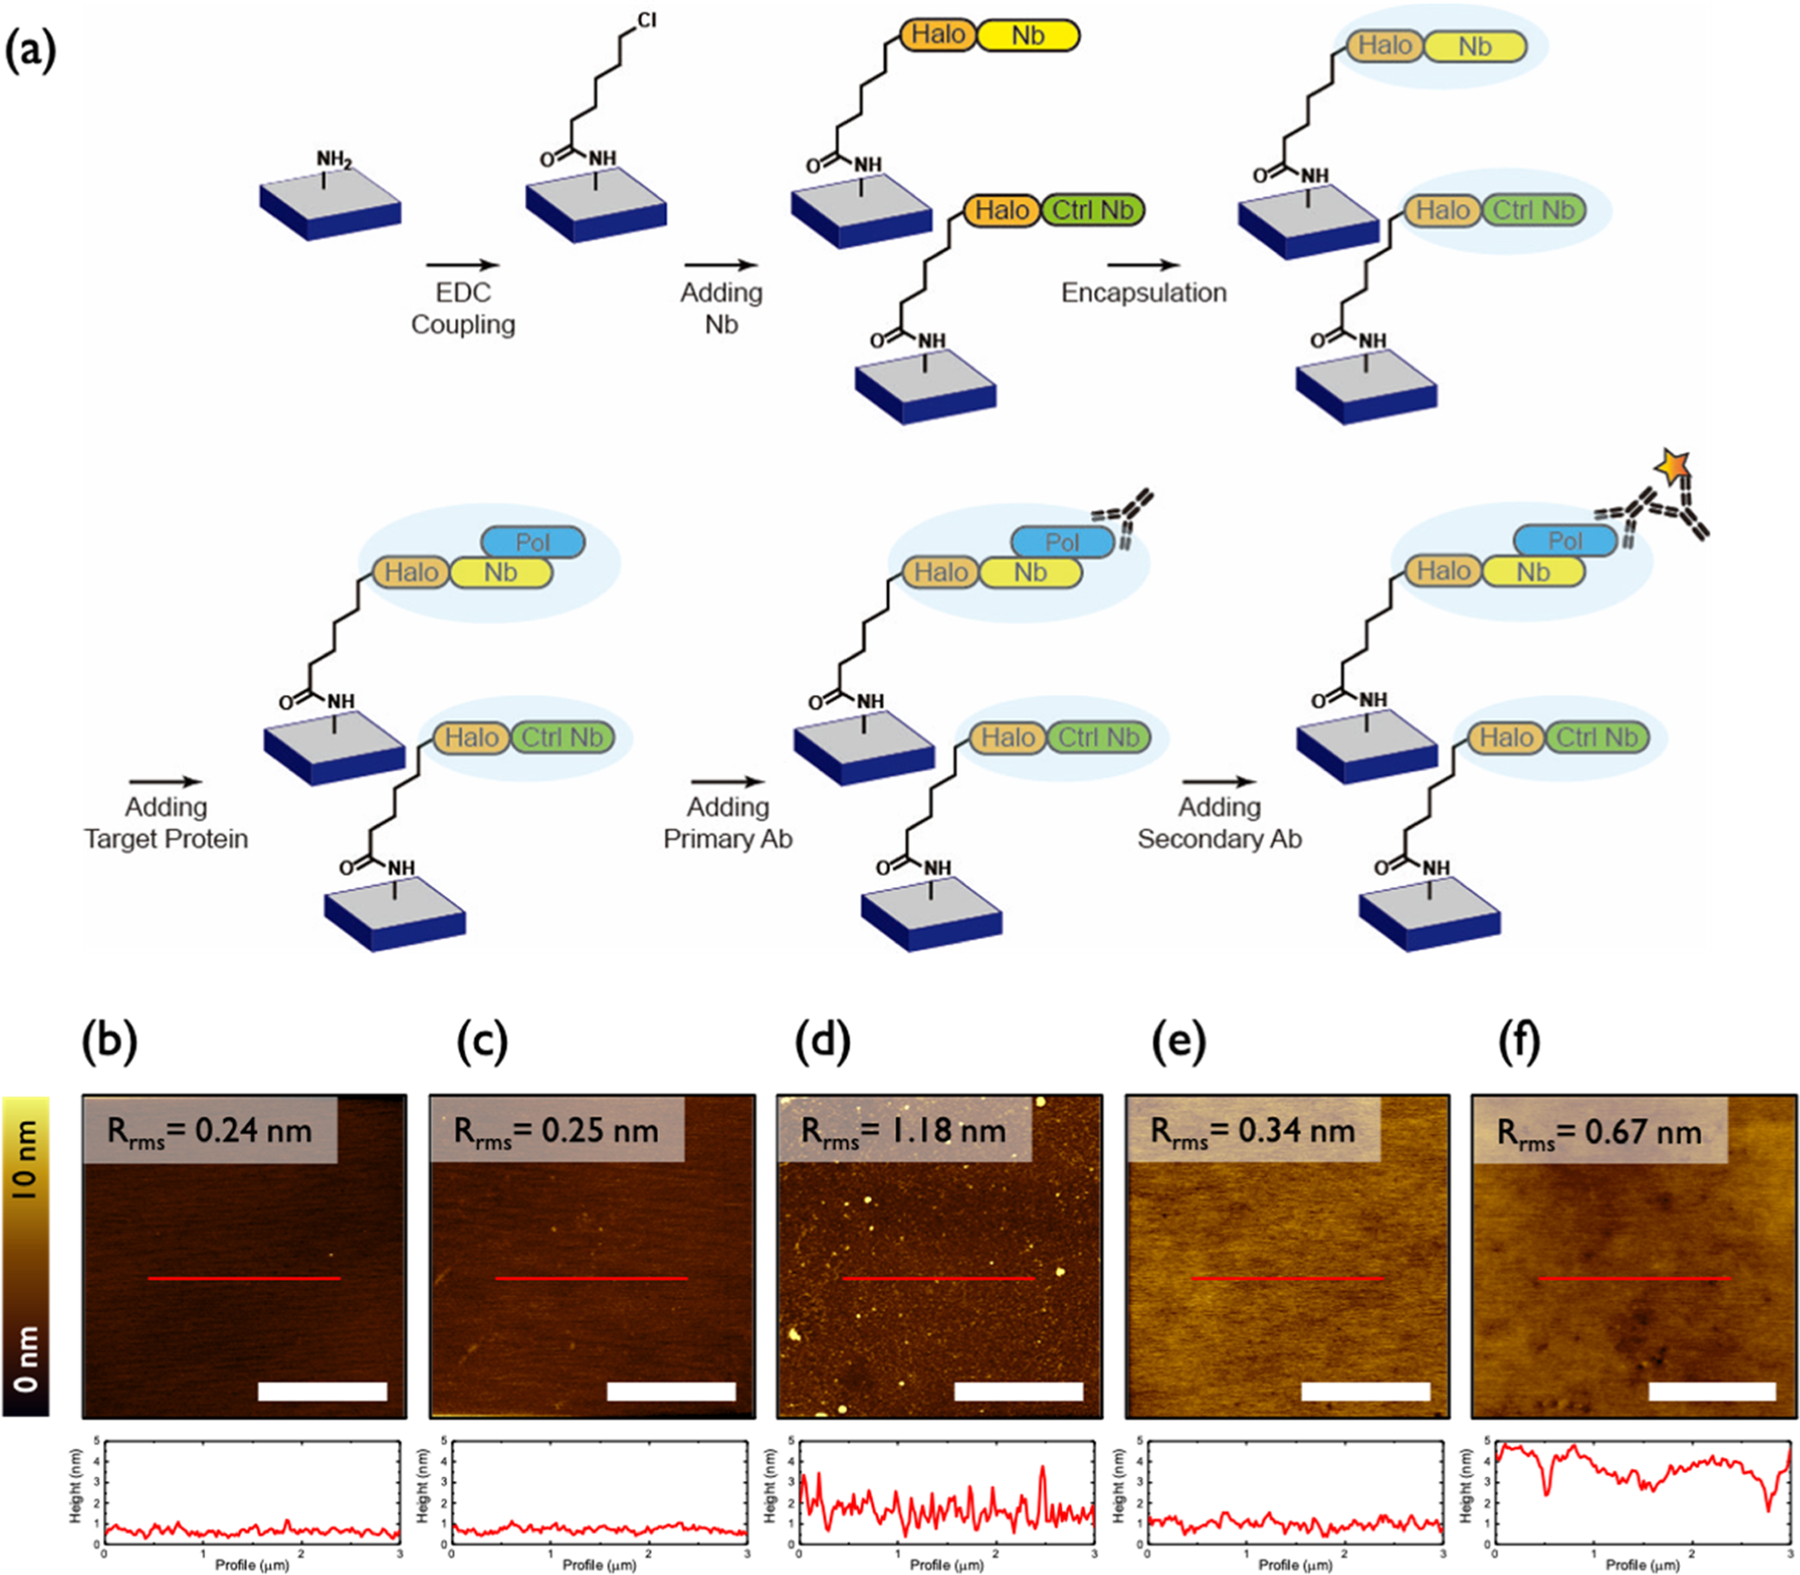
Figure 1.

(a) Schematic illustration of the sensor fabrication process. (b–f) AFM topography images (top) and height profiles (bottom) of sequentially (b) ATPMS-treated, (c) CHA-treated, (d) Nb-treated, (e) pTFOA-encapsulated, and (f) target protein-/antibody-exposed samples. All scale bars are 2 μm.
