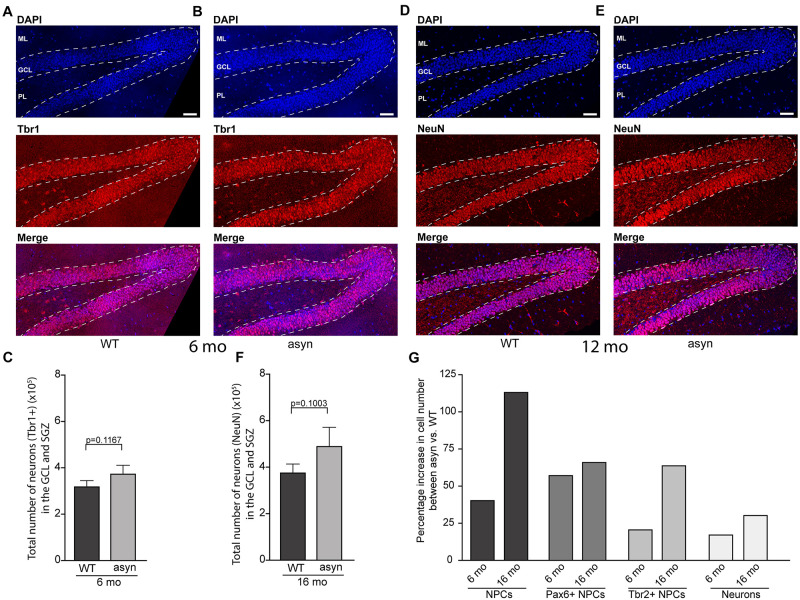
FIGURE 3.
Quantification of Tbr1 and NeuN positive cells in the hippocampal dentate gyrus of wildtype and Thy1-aSyn mice. (A,B) Immunofluorescence for Tbr1 (red) and DAPI staining (blue) and merged images of 6-month-old wildtype [WT, (A)] and Thy1-aSyn [asyn, (B)] mice. Number of Tbr1 + cells (C) in the granular cell layer (GCL) and subgranular zone (SGZ) of 6-month (mo)-old wildtype (WT) and Thy1-aSyn (asyn) mice. (D,E) Immunofluorescence for NeuN (red) and DAPI staining (blue) and merged images of 16-month-old wildtype [WT, (D)] and Thy1-aSyn [asyn, (E)] mice. Number of NeuN + cells (F) in GCL and SGZ of 6 month-old wildtype (WT) and Thy1-aSyn (asyn) mice. (G) Change (percent) in number of PCNA+, Pax6+/PCNA+, Tbr2+/PCNA+ cells and neurons between 6 and 16 month-old Thy1-aSyn (asyn) and wildtype (WT) mice. Data represent mean ± SEM. (WT; 6 month-old, n = 6, 16 month-old n = 6; asyn, 6 month-old, n = 6, 16 month-old n = 5; Student’s t-test). Scale bars, 50 μm.

