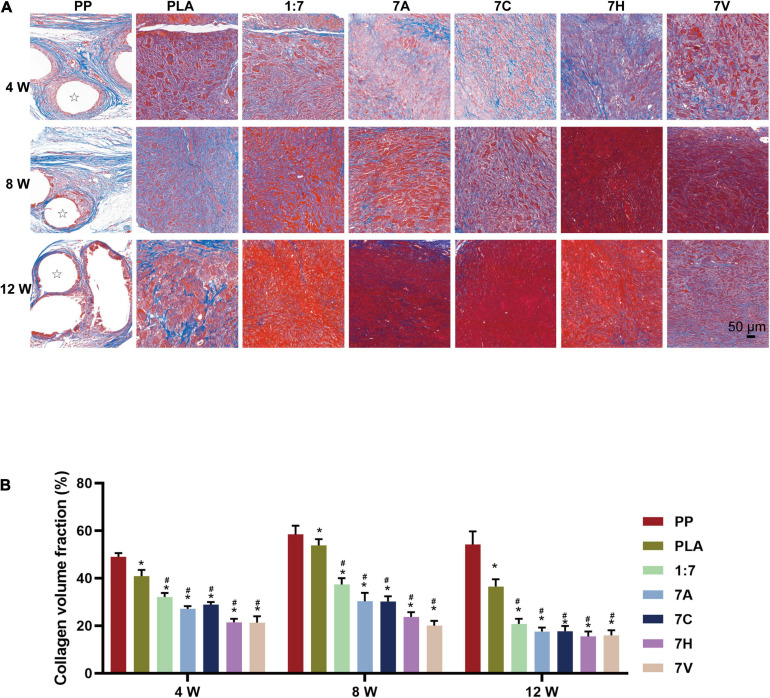
FIGURE 6.
Fibroplasia of regenerative tissue assessed by Masson’s staining. (A) Microscopic morphology of regenerative tissue (4, 8, and 12 weeks after implantation, scale bar = 50 μm). Stars indicate PP mesh fibers. (B) Collagen volume fraction (CVF) used to quantitative analyze fibroplasia of regenerative tissue (4, 8, and 12 weeks after implantation). *P < 0.05 vs. the PP group, #P < 0.05 vs. the PLA group.

