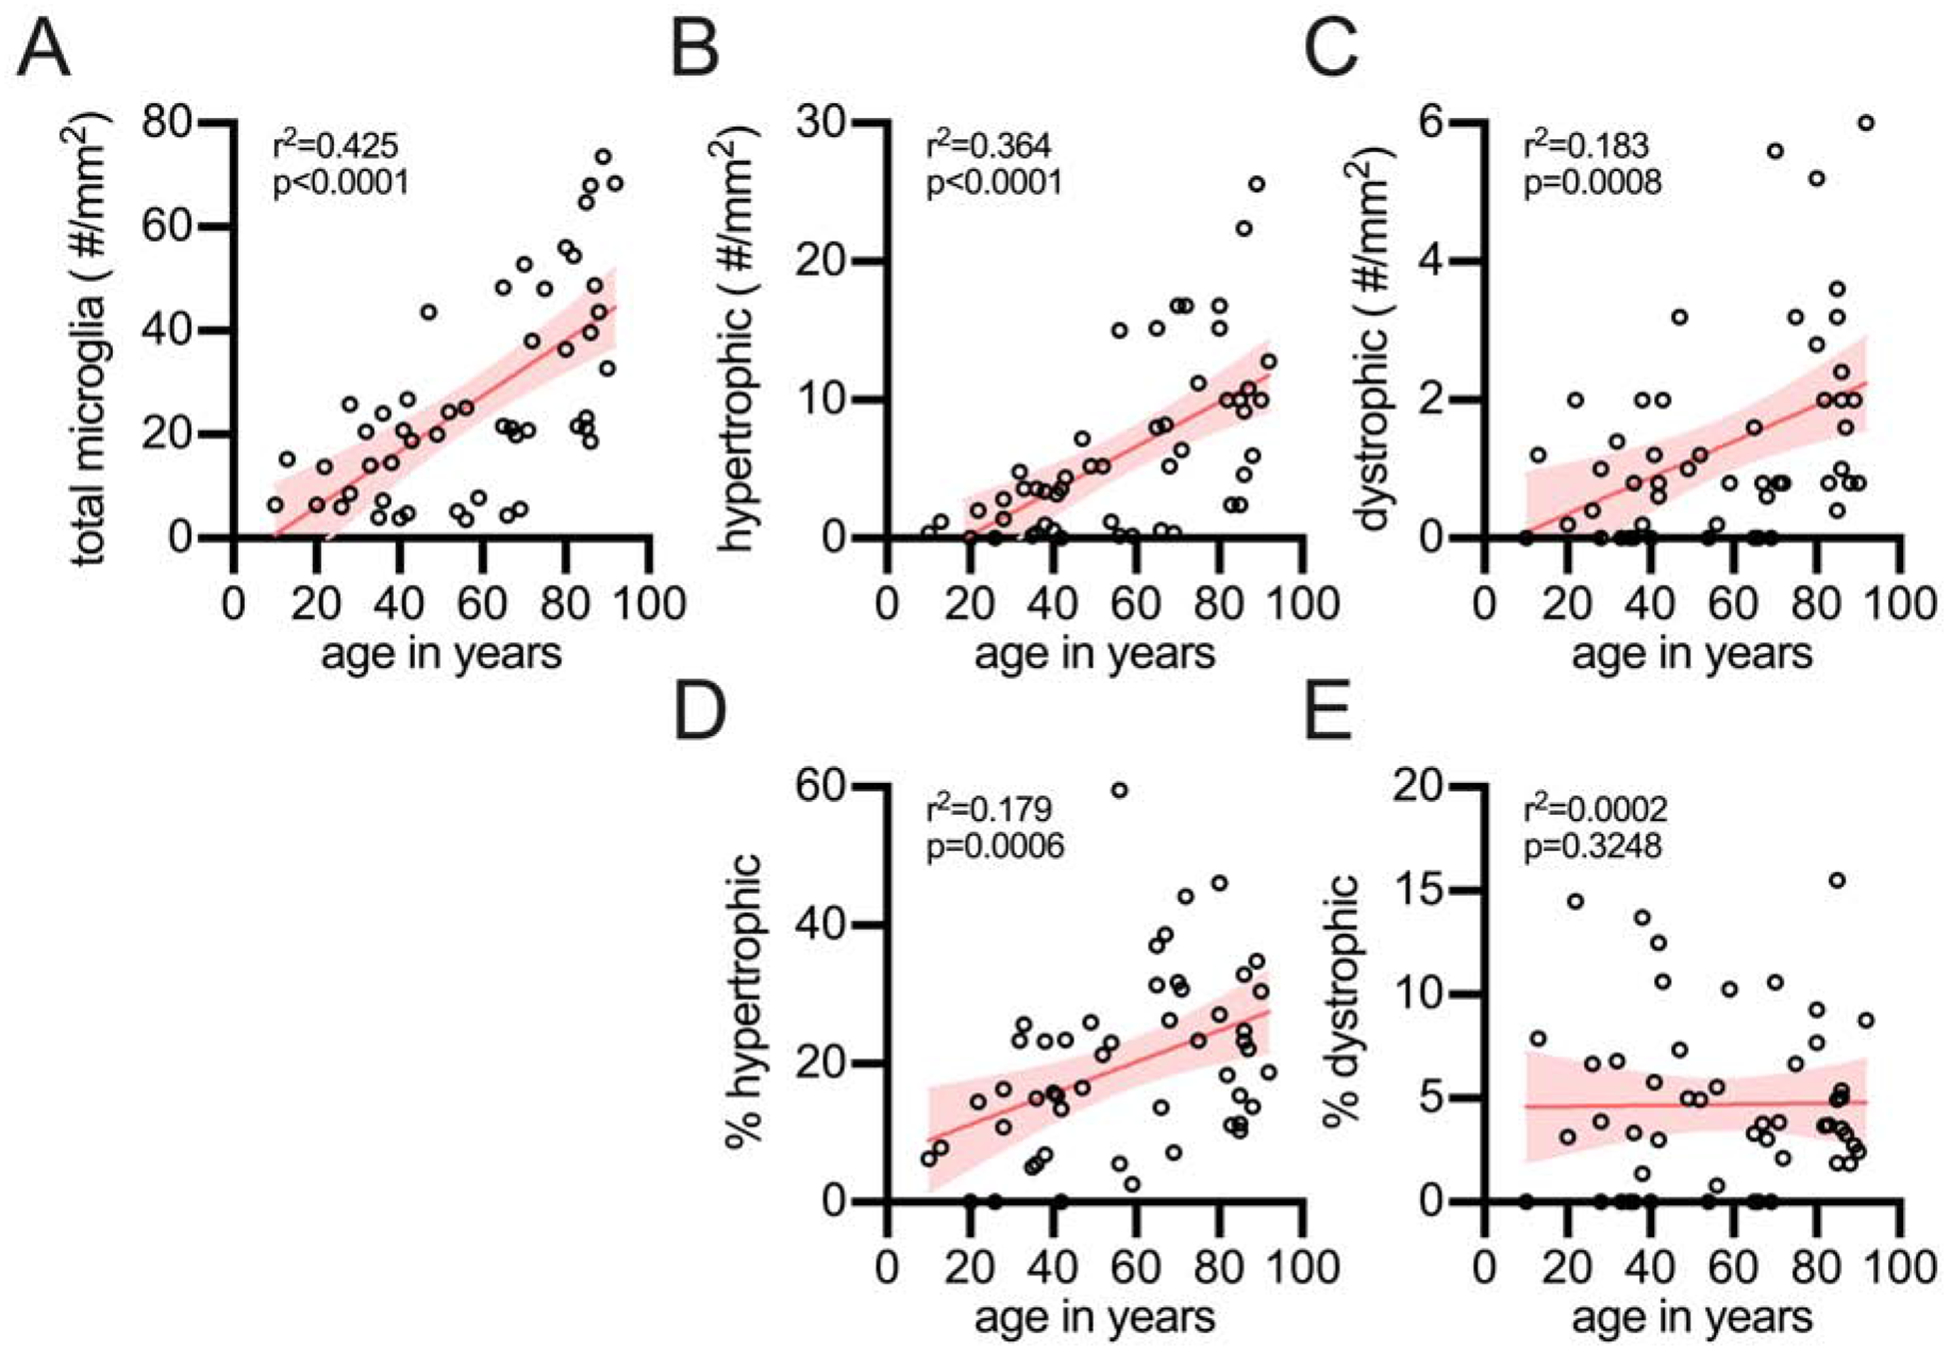
Figure 2: Effect of age on microglial morphology in the CA1 region of the hippocampus.

(A) The total number of microglia, regardless of morphology, were found to increase with age in the hippocampus. The total number of hypertrophic (B), as well as dystrophic microglia (C), were also found to increase in the hippocampus with age. The percentage of the total microglia which are hypertrophic was found to increase with age (D), while the increase in percentage of microglia that were dystrophic (E) was proportional to the total number of microglia, and thus did not increase with age. Each circle is a unique person
