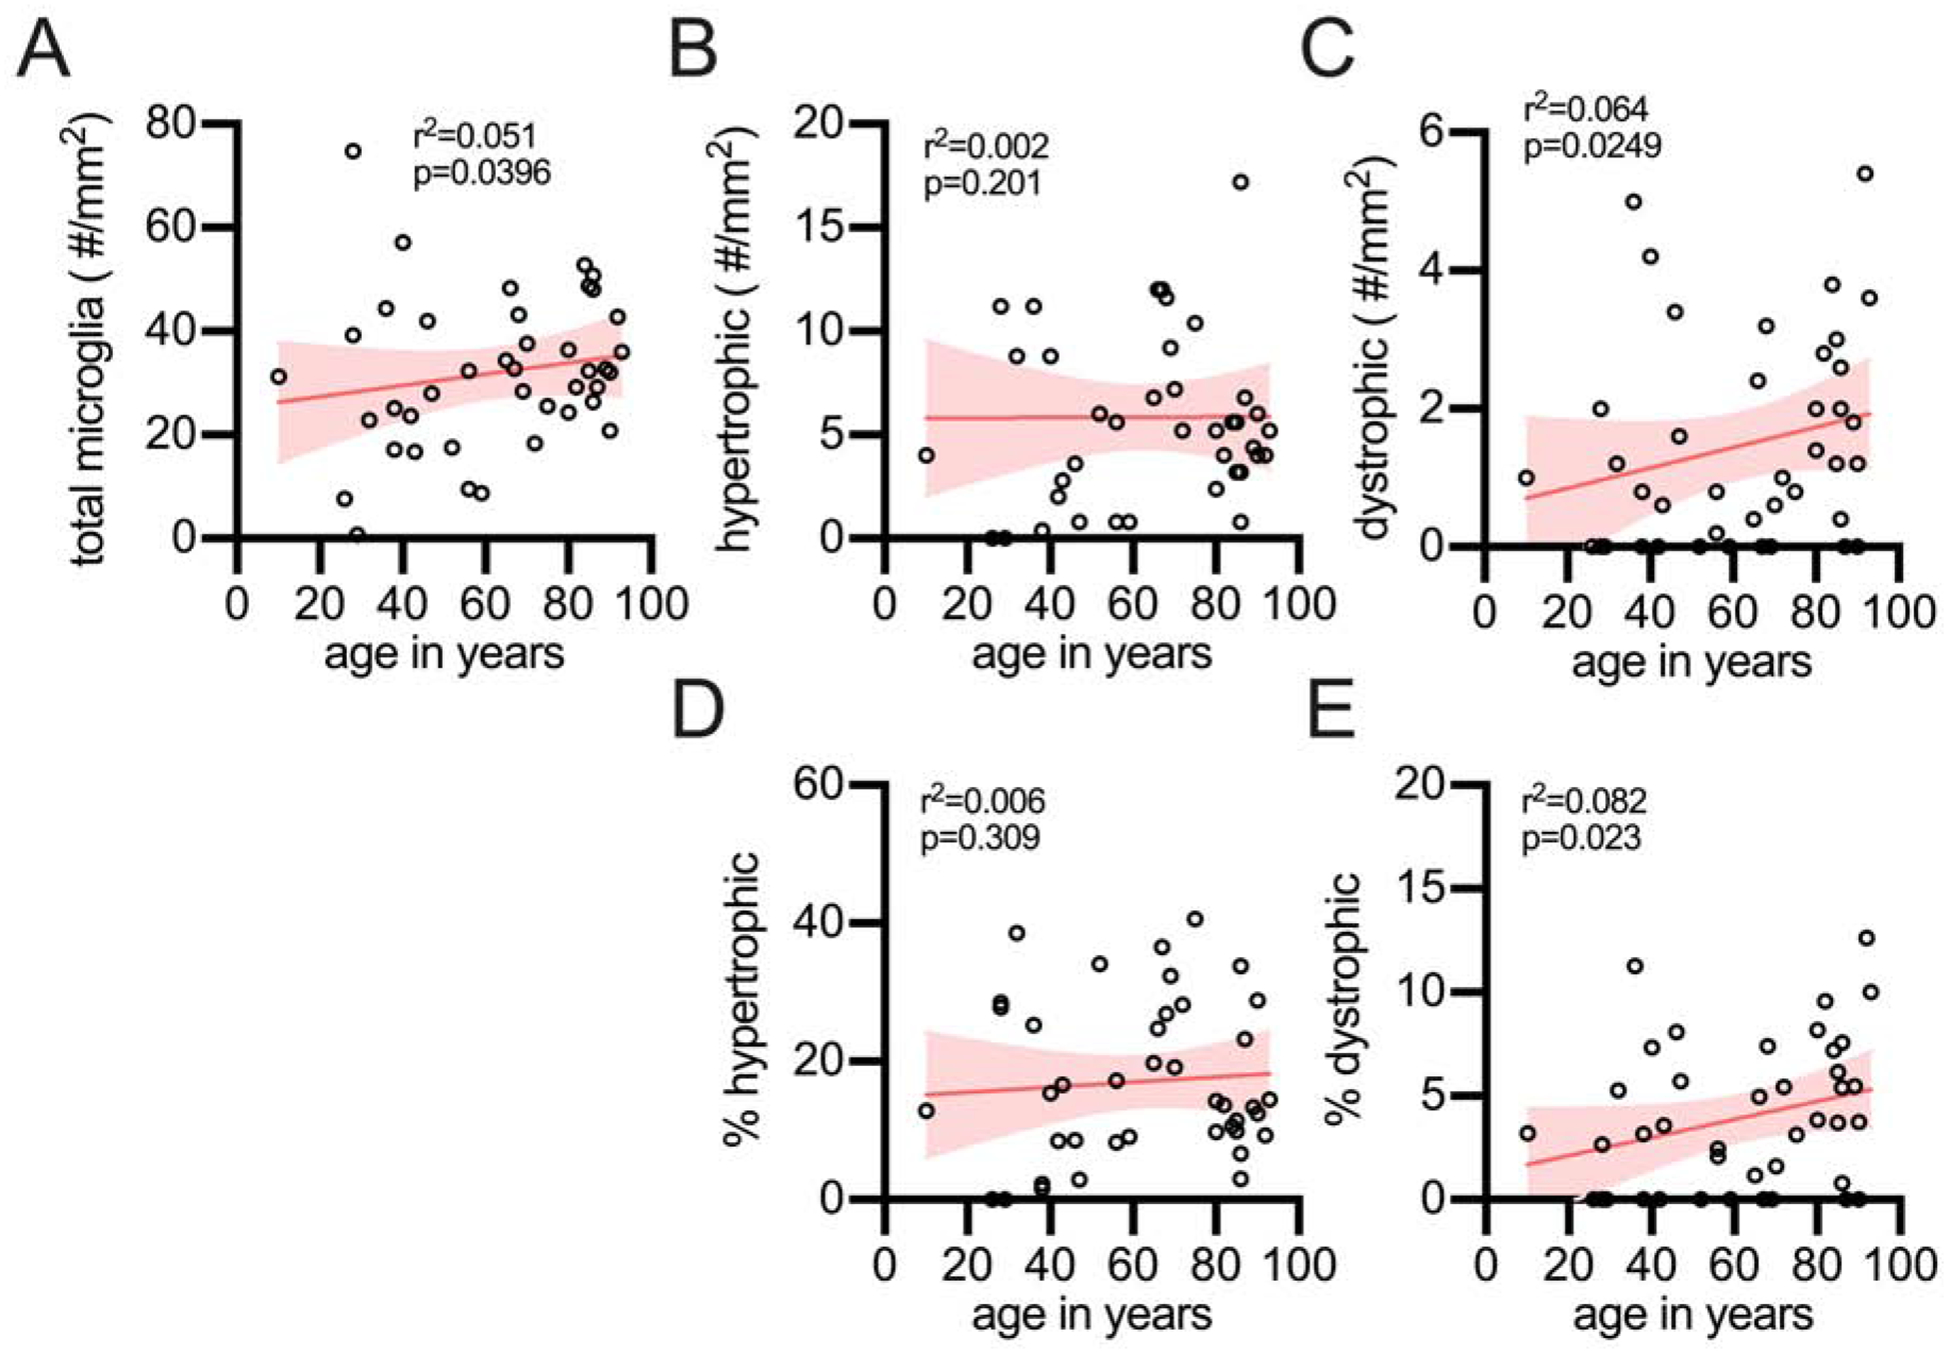
Figure 3: Stereological quantification of microglia morphology in the frontal cortex gray matter as a function of age.

(A) The total number of microglia were found to increase with age. (B) However, hypertrophic microglia showed no age-related increase. (C) Dystrophic microglia were found to increase with age. (D) The percentage of total microglia that were hypertrophic did not increase with age; whereas, (E) dystrophic did increase with age in the frontal cortex gray matter. Each circle is a unique person.
