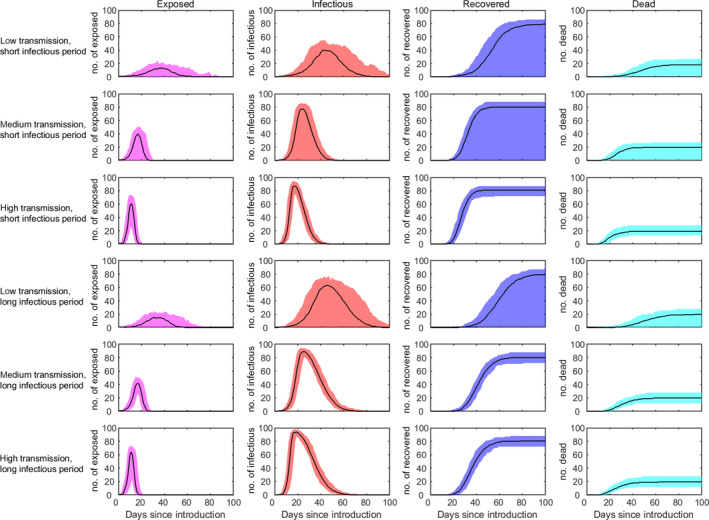
Figure 3.

Within‐herd dynamics of CSFV in pigs. The plots show the median (solid line) and 95% prediction interval (shading) for the number of exposed pigs (magenta), infectious pigs (red), recovered pigs (blue) and cumulative number of dead pigs (cyan) for the six scenarios considered in Table 1; these scenarios differ in terms of R 0 and infectious period (rows; see Table 1 for details)
