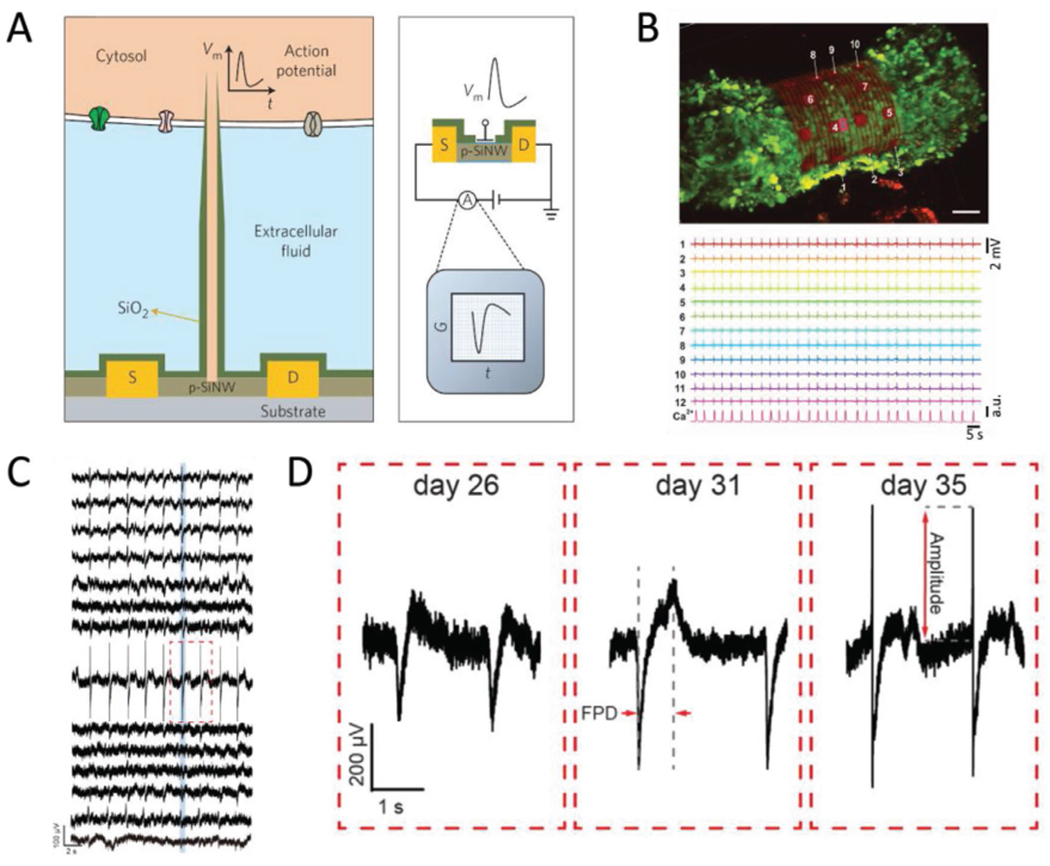
Figure 7.

A survey of nanoelectronic biosensors. A) Schematic of a branched nanowire FET sensor for intracellular recording. A p-type SiNW spine connects to source and drain terminals, with tube-shaped protrusions used to access the intracellular space. A layer of SiO2 passivates the device and insulates the tube from the extracellular fluid. Reproduced with permission.[79] Copyright 2012, Springer Nature. B) 3D self rolled biosensor array enclosing a cardiac spheroid. Sensors placed around the 3D-SR-BA (numbered white arrows, top image) enable high resolution simultaneous recording (bottom traces) of electrical signals throughout the 3D structure, which cannot currently be achieved using confocal microscopy. Scale bar = 50 μm. Reproduced with permission.[62] Copyright 2019, AAAS. C) Traces of the multiplexed recording from the cyborg organoid on day 35. The sensors were distributed throughout the device mesh, such that each trace represents a different sampling region that together cover the entire organoid surface. Adapted with permission.[61] Copyright 2019, American Chemical Society. D) Close up of the red boxed region in panel (C), taken at different stages of organoid development. As organogenesis proceeds, the amplitude of the spike gets bigger, which tracks the regulation of electrical signaling during the organ’s development. Adapted with permission.[61] Copyright 2019, American Chemical Society.
