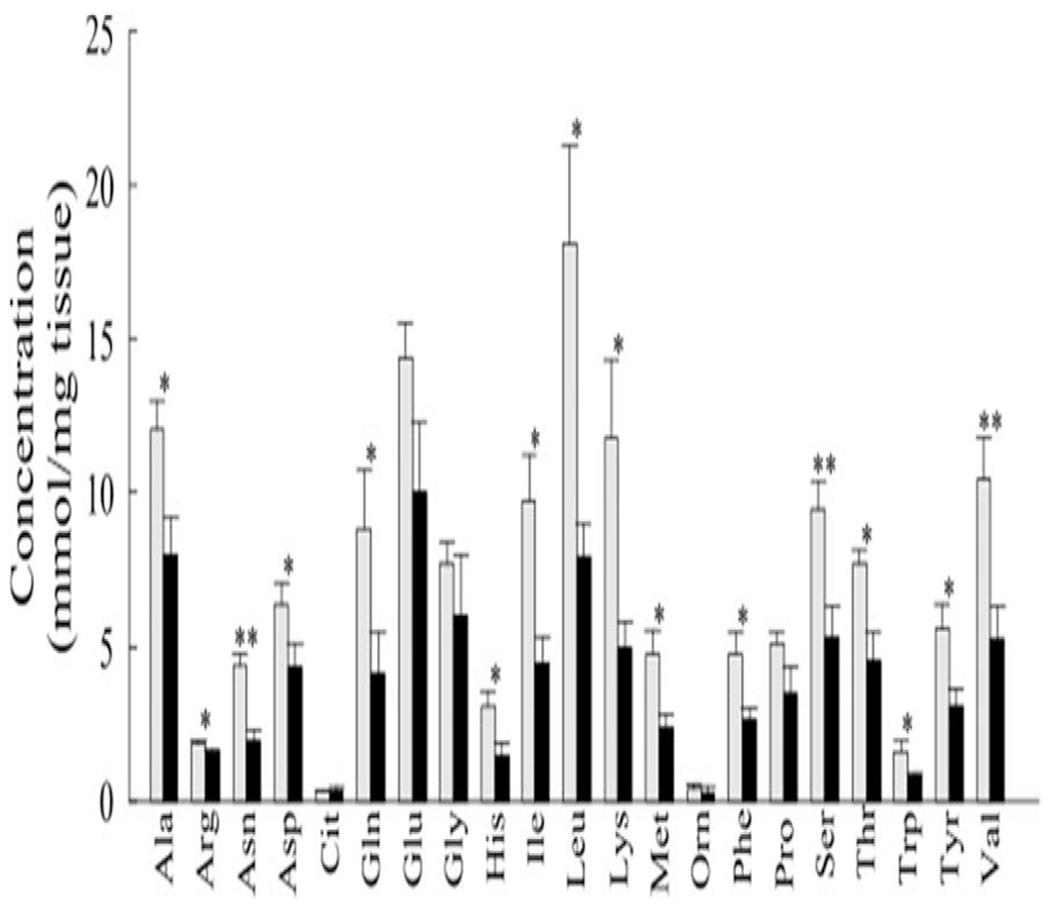
Figure 1.

Concentrations of amino acids from fish guts of King’s Creek (KC; grey bars) and Republic Creosote, Inc. (RCI; black bars) samples. Triplicate measurements from each of three samples were averaged and the bars and error bars represent means and standard deviation of those samples (n=3). Single and double asterisks (*) indicate significant difference at p<0.05 and p<0.01, respectively. Abbreviations follow standard 3-letter nomenclature for amino acids.
