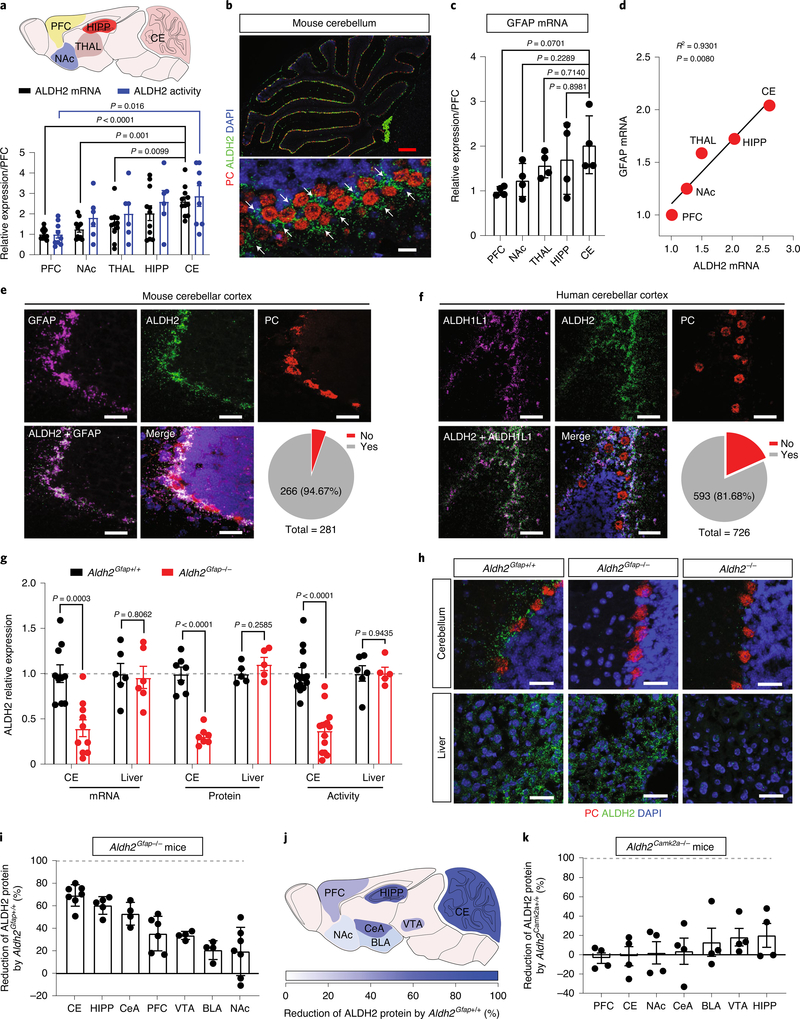
Fig. 1 |. Astrocytic ALDH2 expression in the cerebellum.
a, Upper: schematic diagram of sample collection from different brain regions. Lower: quantitative analysis of ALDH2 mRNA. Bar graphs represent the relative expression of ALDH2 mRNA (black) and ALDH2 enzymatic activity (blue). Data were plotted and normalized to values of the PFC (ALDH2 mRNA: n = 11 mice per group; ALDH2 enzymatic activity: n = 9, 6, 6, 6 and 9 mice per region, respectively). b, Microscopy imaging of mRNA signals in slices from GFAP–GFP mice. GFAP mRNA was detected using an EGFP probe (indicated by white arrows). Scale bars: red, 200 μm; white, 30 μm. c, Quantitative analysis of GFAP mRNA by RT–PCR. Data were normalized to values of PFC (n = 4 mice per group). d, Correlational analysis of the expression levels of ALDH2 and GFAP mRNA in various brain areas (P = 0.008 by linear regression). e,f, Confocal microscopy images showing the colocalization of ALDH2 mRNA with GFAP mRNA in mouse cerebellar slices (e) and ALDH2 mRNA with ALDH1L1 mRNA in human cerebellar slices (f). The grey area represents the colocalization between ALDH2 and GFAP or ALDH1L1. The experiment was repeated four times for each biologically independent mouse or human brain sample, with similar results obtained (n = 3 mice). More detailed information is provided in Supplementary Tables 1 and 2. Yes: colocalization; No: no colocalization; white scale bars, 50 μm. g, Bars represent a brain-specific reduction of ALDH2 mRNA, protein and enzymatic activity in Aldh2Gfap−/− mice. Data were normalized to values of Aldh2Gfap+/+ mice (ALDH2 mRNA: n = 10, 10, 6 and 6 mice, respectively; ALDH2 protein: n = 7, 7, 5 and 5 mice, respectively; ALDH2 enzymatic activity: n = 14, 14, 6 and 5 mice, respectively). h, Confocal microscopy imaging of cerebellar and liver ALDH2 in slices from Aldh2Gfap−/− and Aldh2−/− mice. Each experiment was repeated four times with similar results obtained. White scale bars, 50 μm. i, Measurement of brain ALDH2 proteins by using an automated size-based capillary western blot system in Aldh2Gfap−/− and Aldh2Gfap+/+ mice. Each bar represents the ratio (percentage change) of ALDH2 proteins in Aldh2Gfap−/− versus Aldh2Gfap+/+ mice (n = 7, 5, 4, 6, 4, 4 and 7 mice, respectively). j, Schematic of the relative deficiency of ALDH2 proteins in different brain regions from astrocytic ALDH2-deficient mice. k, Measurement of ALDH2 proteins in different brain areas in Aldh2Camk2a−/− and Aldh2Camk2a+/+ mice (n = 4 mice per group). All data are expressed as the mean ± s.e.m. Analysis was performed using an unpaired two-tailed Student’s t-test (g, i and k) or one-way analysis of variance (ANOVA) followed by Tukey’s test (a and c). CE, cerebellum; HIPP, hippocampus; CeA, central nucleus of the amygdala; VTA, ventral tegmental area; BLA, basolateral amygdala; NAc, nucleus accumbens; THAL, thalamus.

