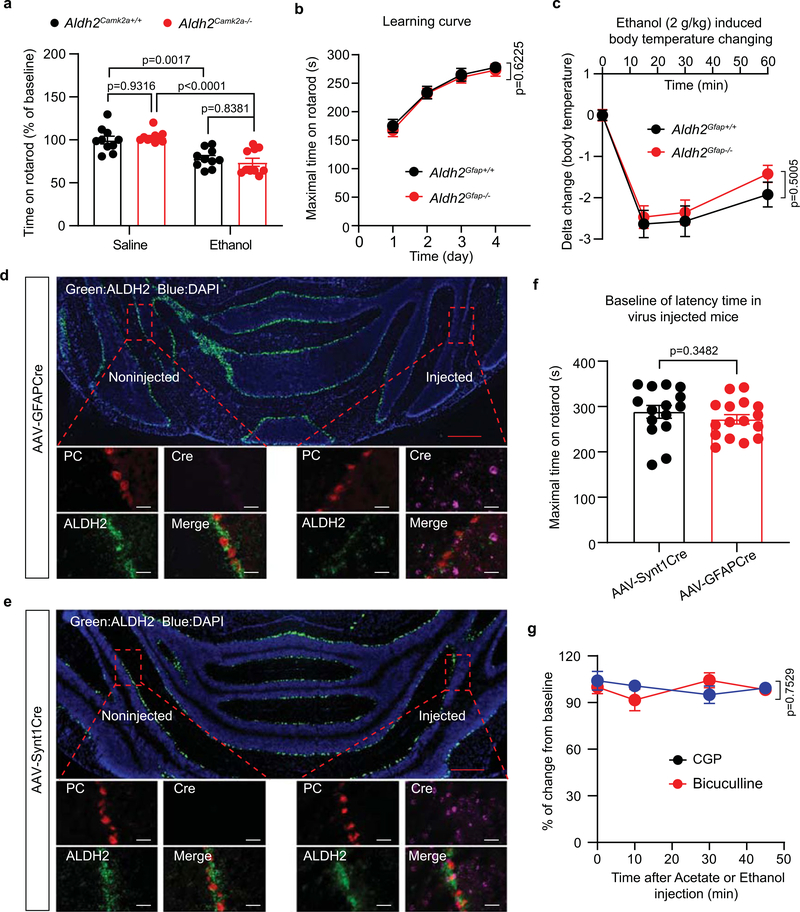
Extended Data Fig. 6 |. Characterization of unilateral conditional deletion of cerebellar astrocytic ALDH2.
a, Bar graph showing the rotarod performance of Aldh2Camk2a+/+ and Aldh2Camk2a−/− mice (n=10 mice/group) after 10 min 1 g/kg ethanol i.p. injection. b, Time course of the basal levels of the rotarod performance in consecutive trails in Aldh2Gfap+/+ (n=9) and Aldh2Gfap−/− (n=10) mice. c, Time courses of core-body temperature after ethanol (2 g/kg, i.p.) in Aldh2Gfap+/+ (n=9) and Aldh2Gfap−/− (n=13) mice. d,e, Florescent microscopy images of ALDH2 signal (green) in cerebellar slices from Aldh2 flox mice previously injected with AAV-GFAPCre and AAV-Synt1Cre virus (4 weeks after injection). Experiments were repeated four times for each biologically independent mouse, with similar results obtained (n=3 mice). Red scale bar, 500 μm; White scale bars, 50 μm. f, Bar graph showing the baseline levels of rotarod performance in cerebellar virus injected mice (n=15 mice for AAV-Synt1Cre; n=16 mice for AAV-GFAPCre). g, Time courses of the levels of rotarod performance after i.c.v. injection of CGP (200 ng, n=7 mice) or Bicuculline (200 ng, n=5 mice). Data are presented as mean±s.e.m. Analysis was performed using unpaired two tailed student’s t test (f) or two-way analysis of variance (ANOVA) followed by Turkey’s test (a), or two-way repeated-measures analysis of variance (ANOVA) (b,c,g).

