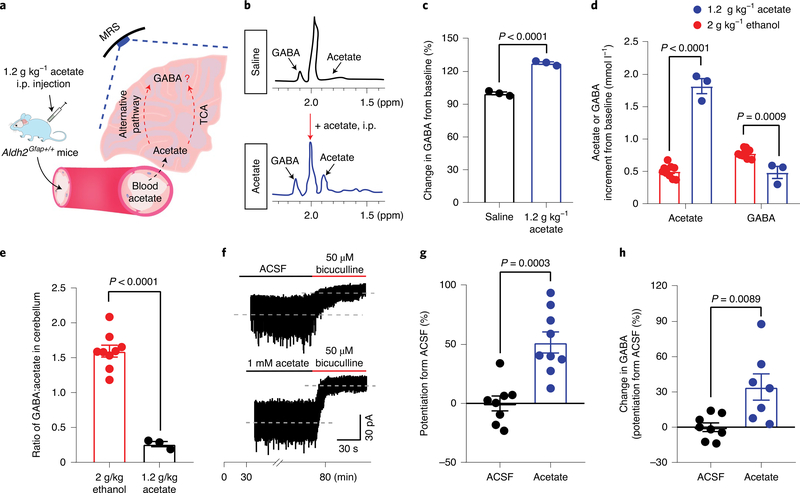
Fig. 5 |. Acetate enhancement of GABA synthesis and GABA tonic inhibition in cerebellum.
a, Schematic of brain GABA synthesis after systemic acetate administration. b, Representative MRS peaks of acetate and GABA after systemic acetate (1.2 g kg−1, i.p., blue) and saline (black) in mice. c, Summary statistics of GABA content from baseline after systemic administration of either saline or acetate. Data were calculated as the percentage change in GABA (before versus after acetate) in the cerebellum (n = 3 mice per group). d, Acetate or GABA increment from baseline after systemic ethanol or acetate administration in the cerebellum (1.2 g kg−1 acetate: n = 3 mice; 2 g kg−1 ethanol: n = 9 mice) e, The ratio of GABA:acetate after systemic ethanol or acetate administration in the cerebellum of mice (1.2 g kg−1 acetate: n = 3 mice; 2 g kg−1 ethanol: n = 9 mice). f,g Trace records and summary statistics of GABA tonic currents recorded from GCs of cerebellar slices without and with acetate pretreatment (n = 8 and 9 cells, respectively; 6 mice). h, Summary statistics of GABA content in cerebellar slices after acetate pretreatment as measured by LC–MS/MS (n = 8 and 7 mice, respectively). All data are the mean ± s.e.m. Groups were compared by an unpaired two-tailed Student’s t-test (c–e, g and h).

