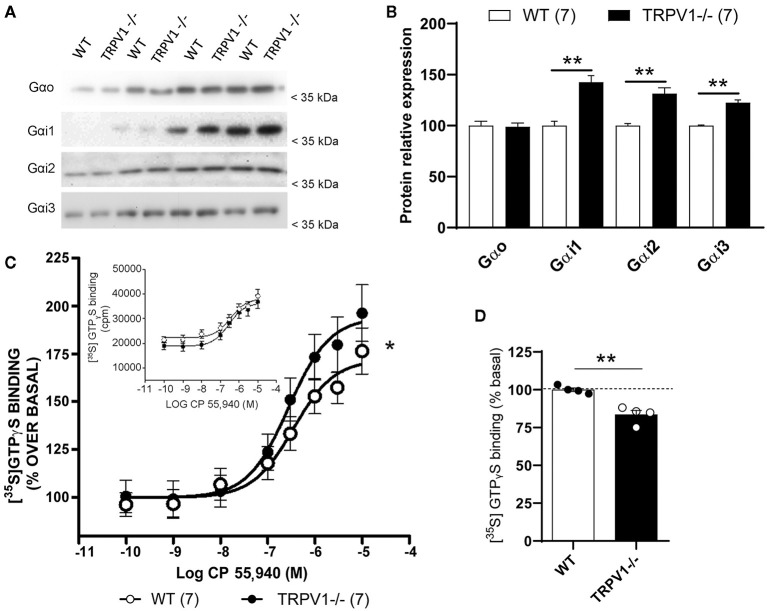
Figure 4.
Molecular changes in Gαo and Gαi subunits in TRPV1-/-. (A,B) Immunoblot and relative expression of Gαo, Gαi1, Gαi2, and Gαi3 proteins in synaptosomal extracts with increasing protein concentrations (4, 8, 12, and 16 μg/μl) from WT and TRPV1-/- mice hippocampi. p > 0.05; *p < 0.05; **p < 0.005. Data are expressed as mean ± SEM. (C) CP 55,940-stimulated [35S]GTPγS binding assay in the hippocampal synaptosome fractions from WT and TRPV1-/-. Concentration curves were constructed using mean values ± SEM from four different experiments performed in triplicate. Paired t-test; *p < 0.05. Inset: CP 55,940 concentration–response curves are expressed in cpm (counts per minute) to show non-normalized basal (WT: 22.179 ± 2.844 cpm vs. TRPV1-/-: 18.715 ± 2.816. Paired t-test; *p < 0.05) and Emax values (WT: 39.079 ± 2.844 cpm vs. TRPV1-/-: 36.251 ± 2.285 cpm. Paired t-test; ns; p > 0.05). (D) Bar graph representing the relative percentage of [35S]GTPγS basal binding levels in WT and TRPV1-/-. Unpaired t-test; **p < 0.005. Data are represented as mean ± SEM.

