
Figure 1.
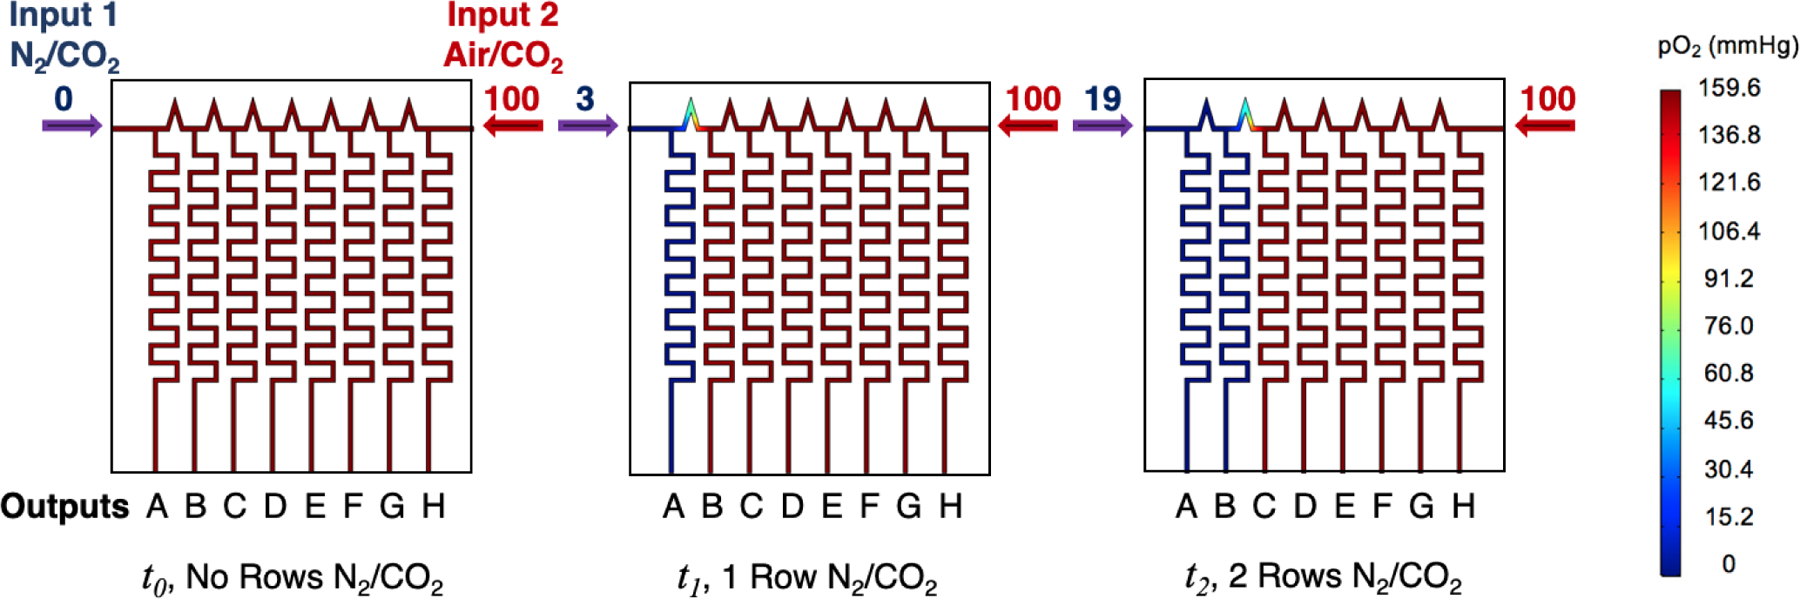
COMSOL modeling of pO2 content in flow-encoding manifold at different flow-rates of Input 1 Gas 95% N2 /5% CO2 and Input 2 Gas 95% Air/5% CO2 at an initial time point, t0, and arbitrary time points t1,t2. At t1, the N2/CO2 flow rate is increased to 3 mL/min, which causes output A to become hypoxic. At t2, the flow rate is further increased to 19 mL/min, causing outputs A and B to become hypoxic. The flow rates of the two gases are given above the blue and red arrows in each figure. The heat maps of content show sequential switching of output gas channels of each row A-B from air/CO2 to N2/CO2 at each time point.