
Figure 3.
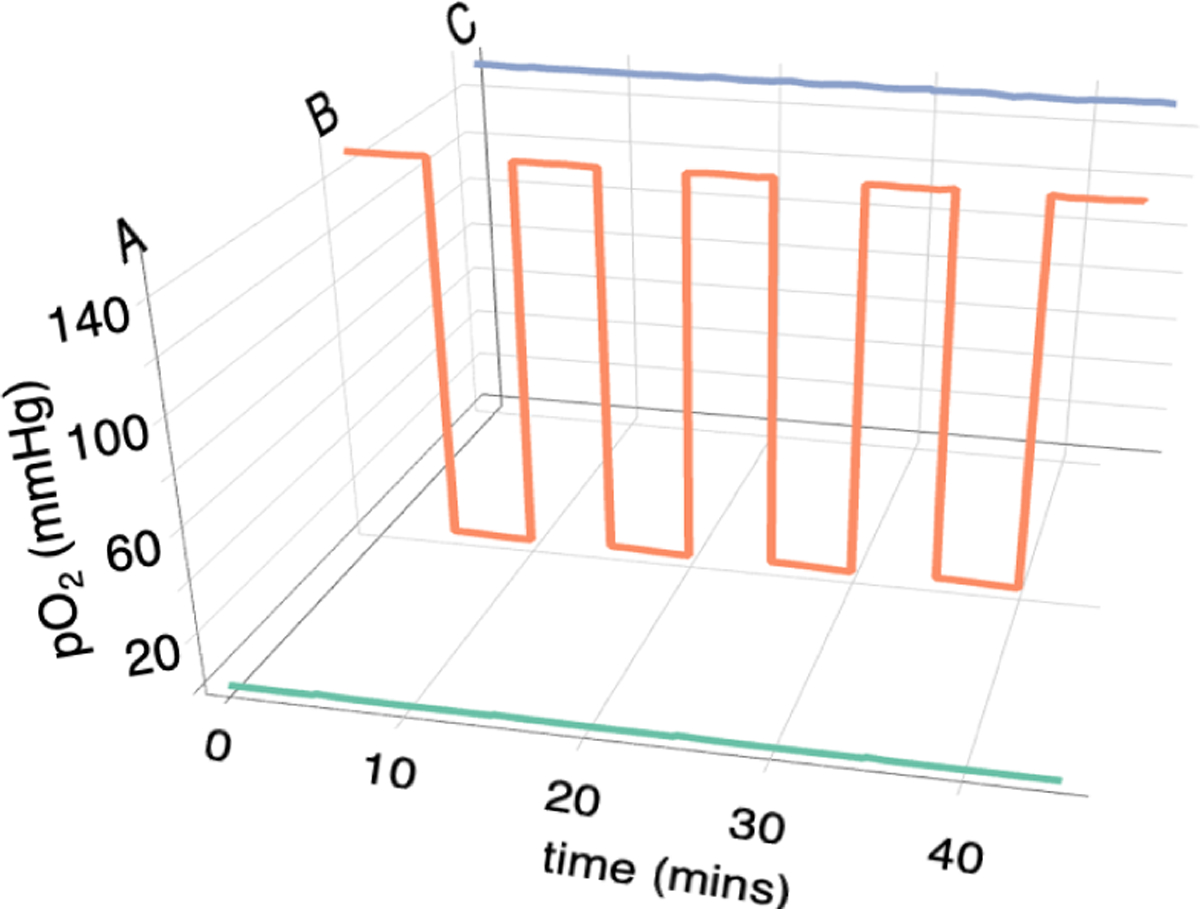
Measured pO2 levels at the manifold outputs when the input flow rates were switched every 5 min and designed to maintain output to Row A at constant N2, output B was cycled between N2 and air and the outputs to C-H were held at constant air. Only the outputs to rows A - C are shown.