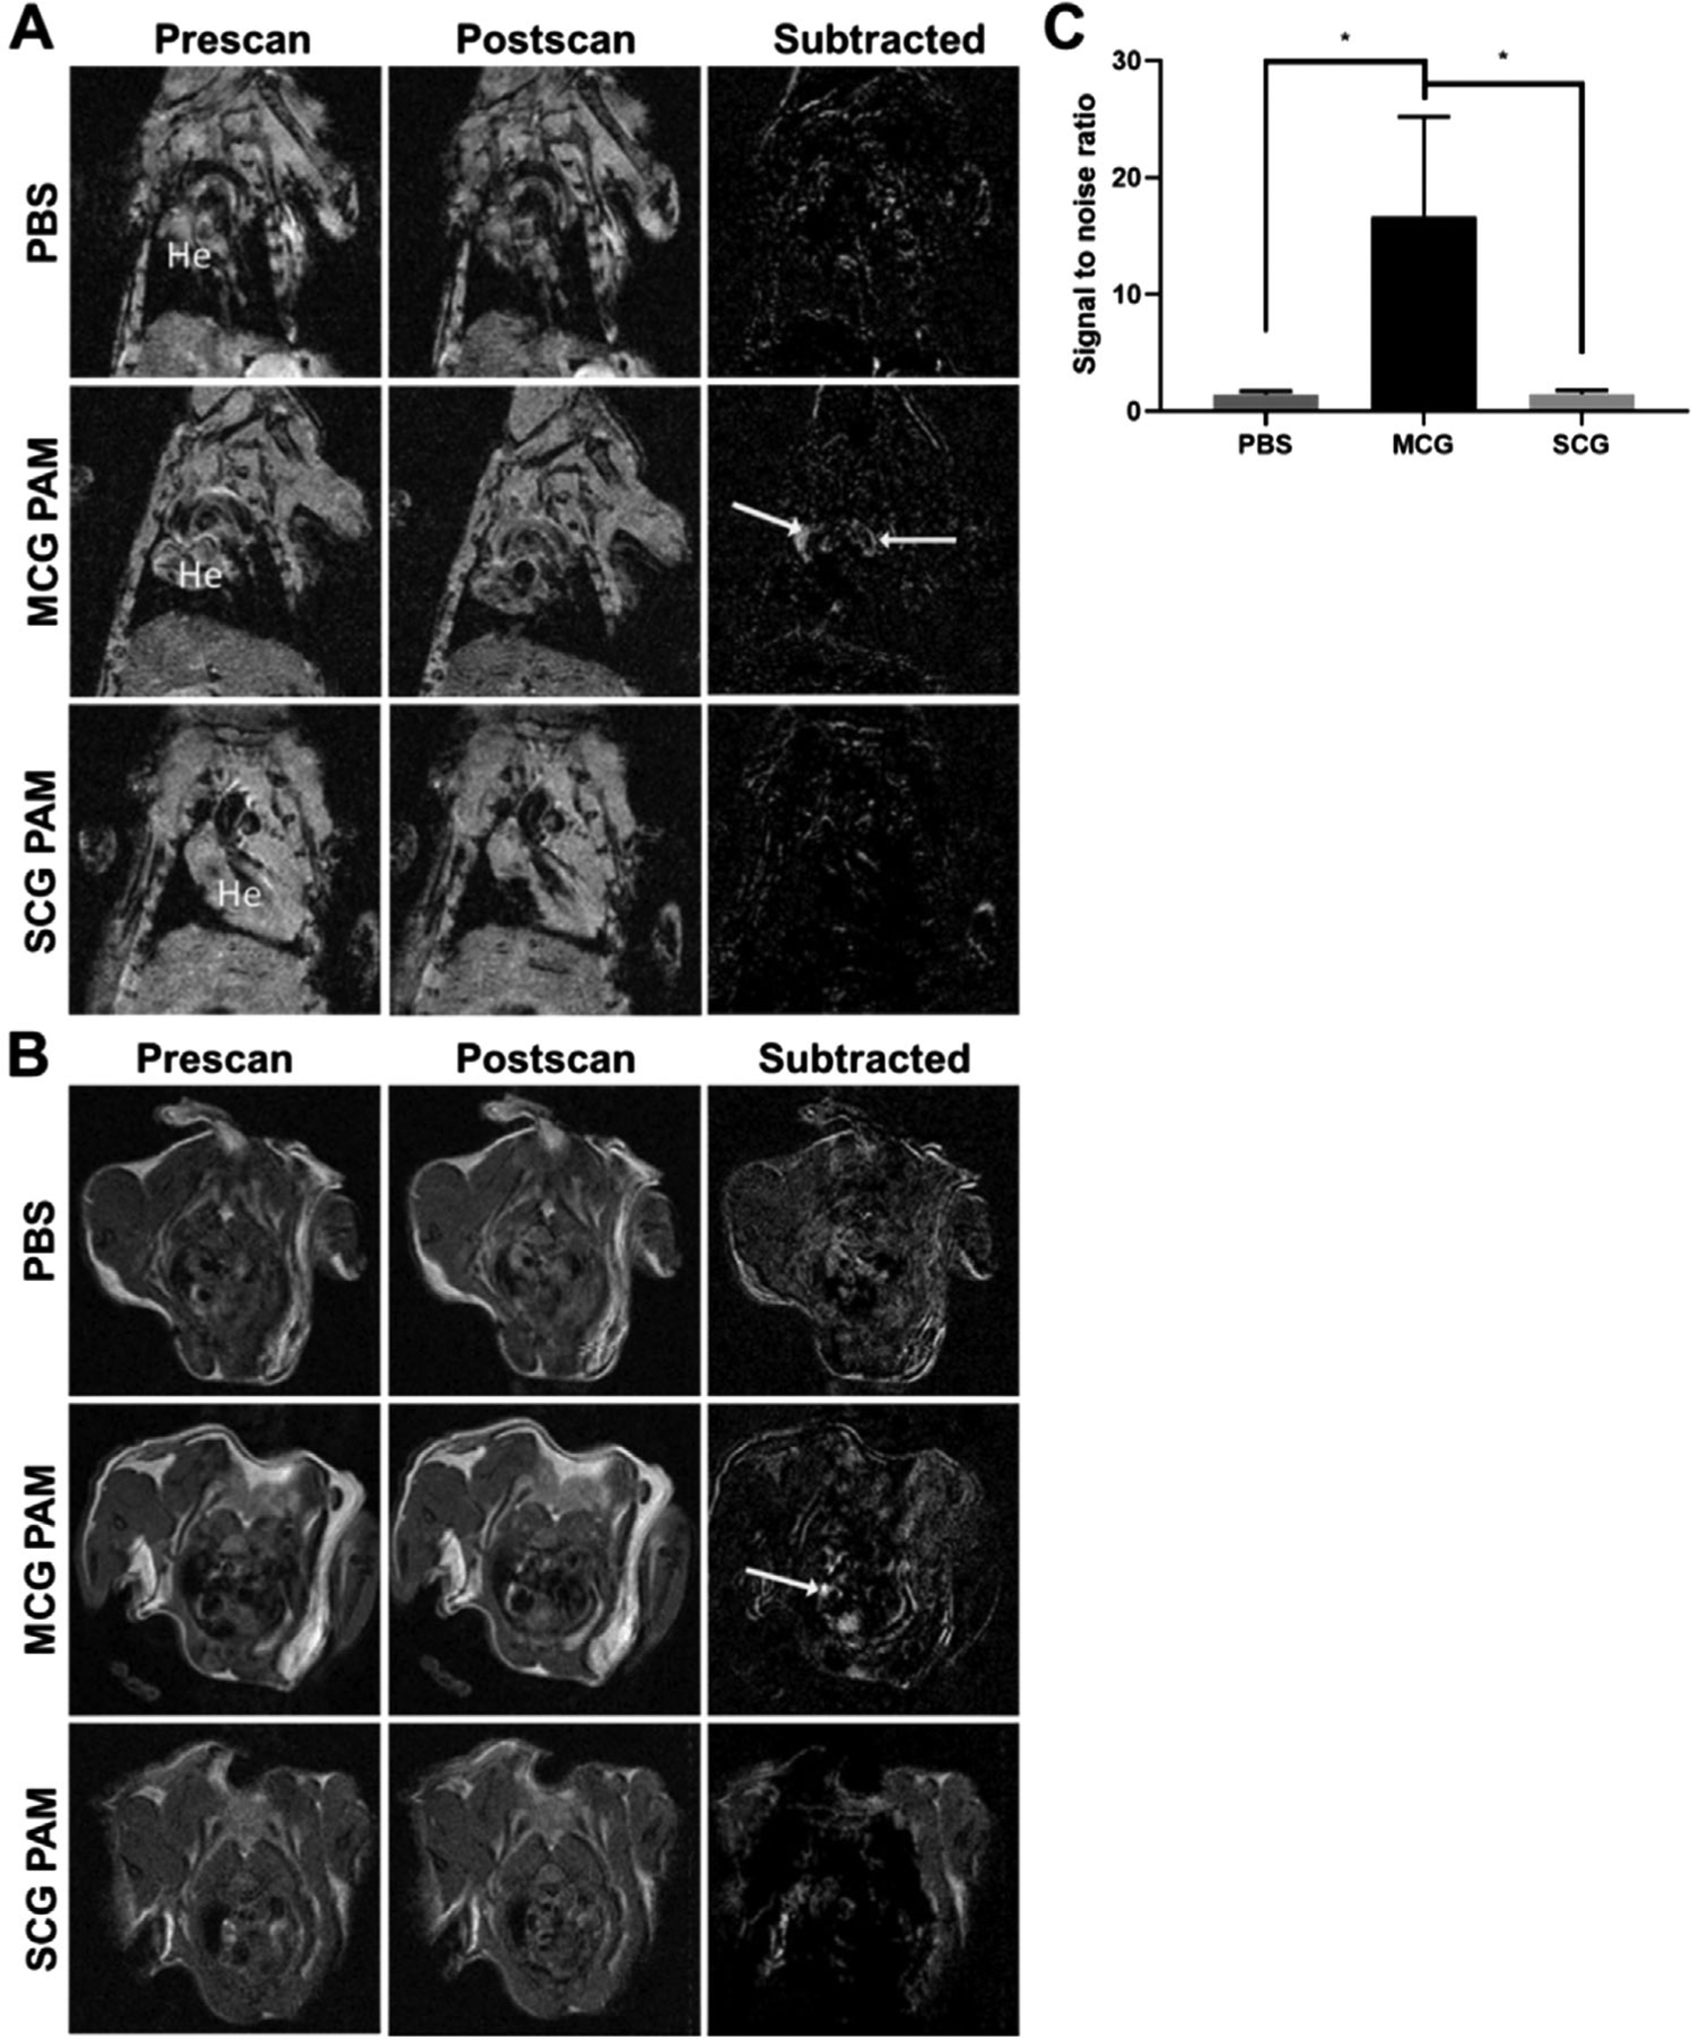
Figure 2.

MR images of MCG PAM-, SCG PAM-, and PBS-treated mice. MCG PAMs show MR signal enhancement in atherosclerotic plaques in the aorta (arrows) as shown via A) coronal (He = heart) and B) transverse scans. No tissue enhancement is observed with SCG PAM and PBS treatment (N = 3 for PBS or 4 for MCG PAM and SCG PAM). C) MCG PAMs demonstrate significant increases in SNR compared to PBS and SCG PAMs (MCG PAM: 16.68, SCG PAM:1.52, PBS:1.46, N = 4 for MCG PAM and SCG PAM and N = 3 for PBS, one-way ANOVA *p ≤ 0.05).
