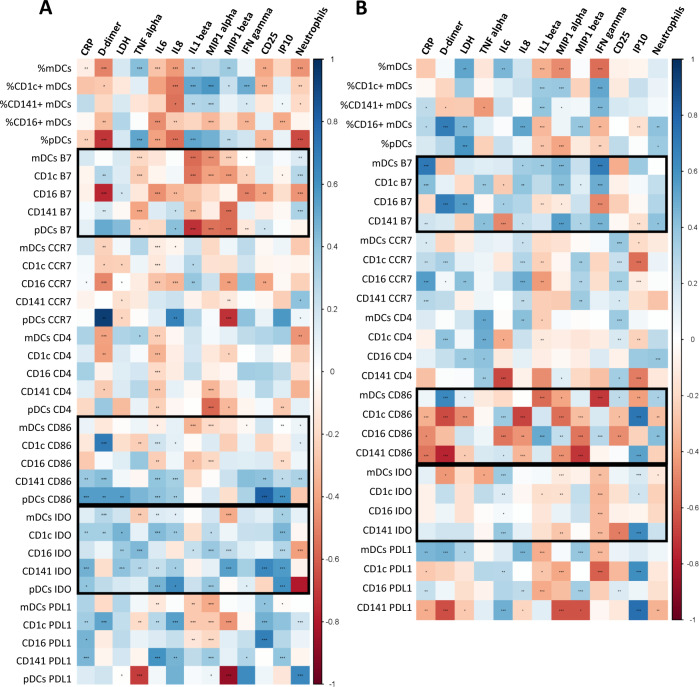
Fig. 3.
DC parameters are differentially associated to inflammatory markers in mild and severe acute SARS-CoV-2 infected patients. Heatmap graphs representing correlations between the percentages of DC subpopulations and the percentages of DCs expressing activation and homing markers with inflammatory marker levels including CRP, D-dimer, LDH, TNF-α, IL-6, IL-8, IL1-β, MIP1-α, MIP1-β, IFN-γ, CD25, IP-10, and neutrophil numbers, in mild (A) and severe (B) SARS-CoV-2 infected patients. Blue color represents positive correlations and red color shows negative correlations. The intensity of the color indicates the R coefficient. The most relevant data are highlighted with black squares. *p < 0.05; **p < 0.01; ***p < 0.001. Spearman test was used for nonparametric correlations

