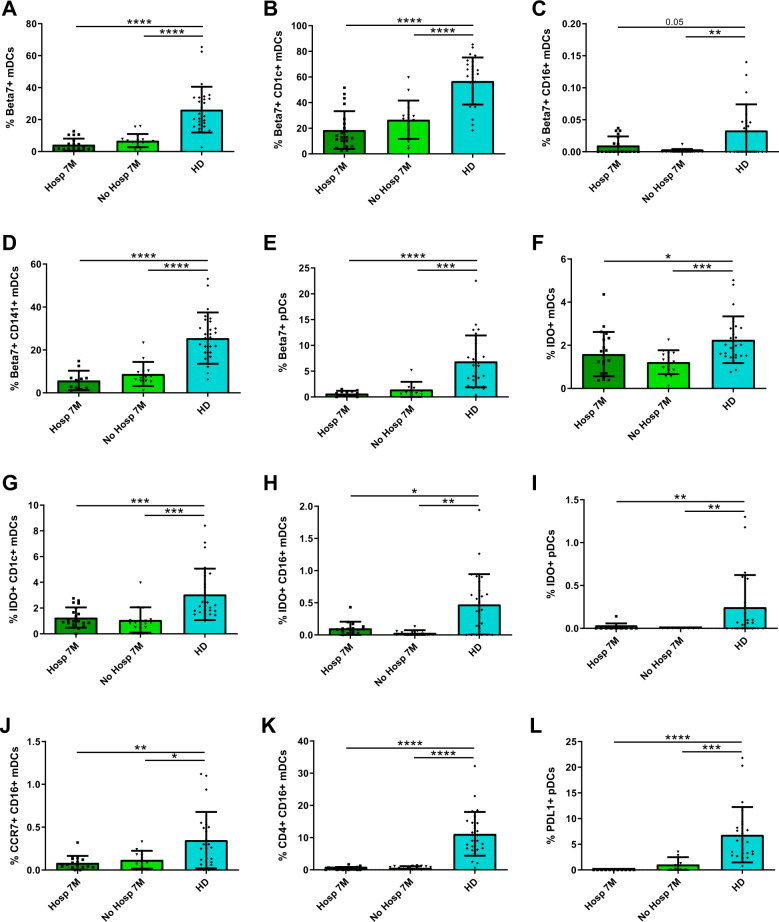
Fig. 6.
Some DC activation markers are not normalized neither in previously hospitalized nor in nonhospitalized patients 7 months after SARS-CoV-2 infection. Bar graphs representing the percentage of DC subpopulations expressing β7 (A–E), IDO (F–I), CCR7 (J), CD4 (K), and PD-L1 (L) in previously hospitalized (Hosp 7M) or previously nonhospitalized (No Hosp 7M) patients 7 months after SARS-CoV-2 infection and in healthy donors (HD). The median with the interquartile range is shown and each dot represents an individual. *p < 0.05; **p < 0.01; ***p < 0.001; ****p < 0.0001. Mann–Whitney U test was used for groups’ comparisons

