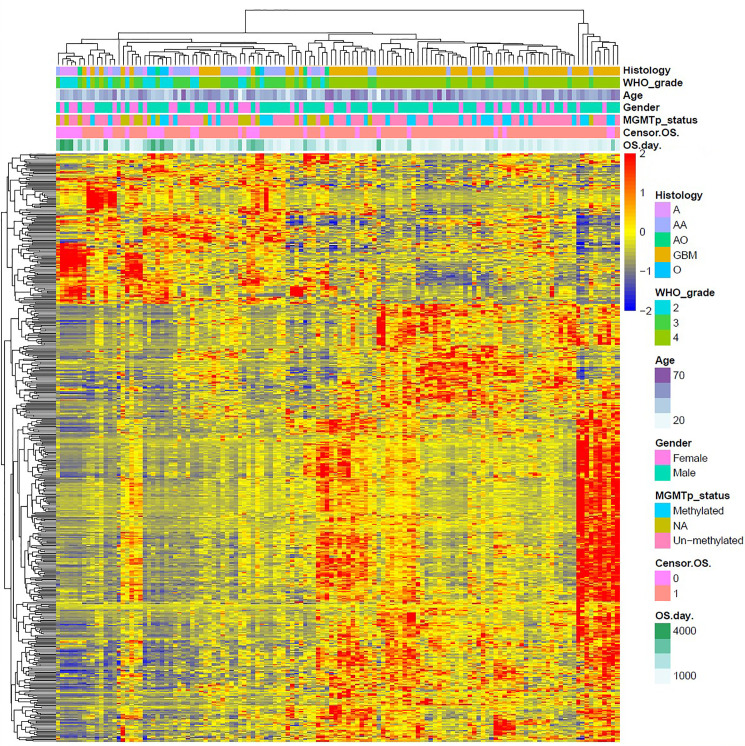
Figure 2.
Supervised cluster analysis of the gene sequencing data. We obtained gene heat maps describing gene expression in the different patient groups and found that there were obvious differences in gene expression levels and gene expression types between IDH-wt LGG patients and IDH-wt GBM patients.

