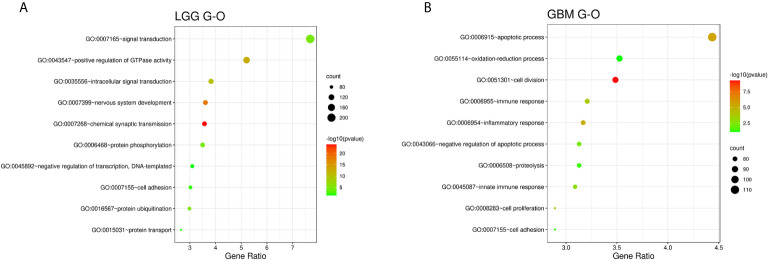
Figure 3.
Functional enrichment analysis of associated genes for LGG (A) and GBM (B), indicating the functional roles of the gene sets in the different subgroups. Enrichment results for biological processes were obtained from the GO database. The orders of the biological processes listed in the bubble chart are based on the number of targets annotated in biological process (BP).

