
Fig. 5.
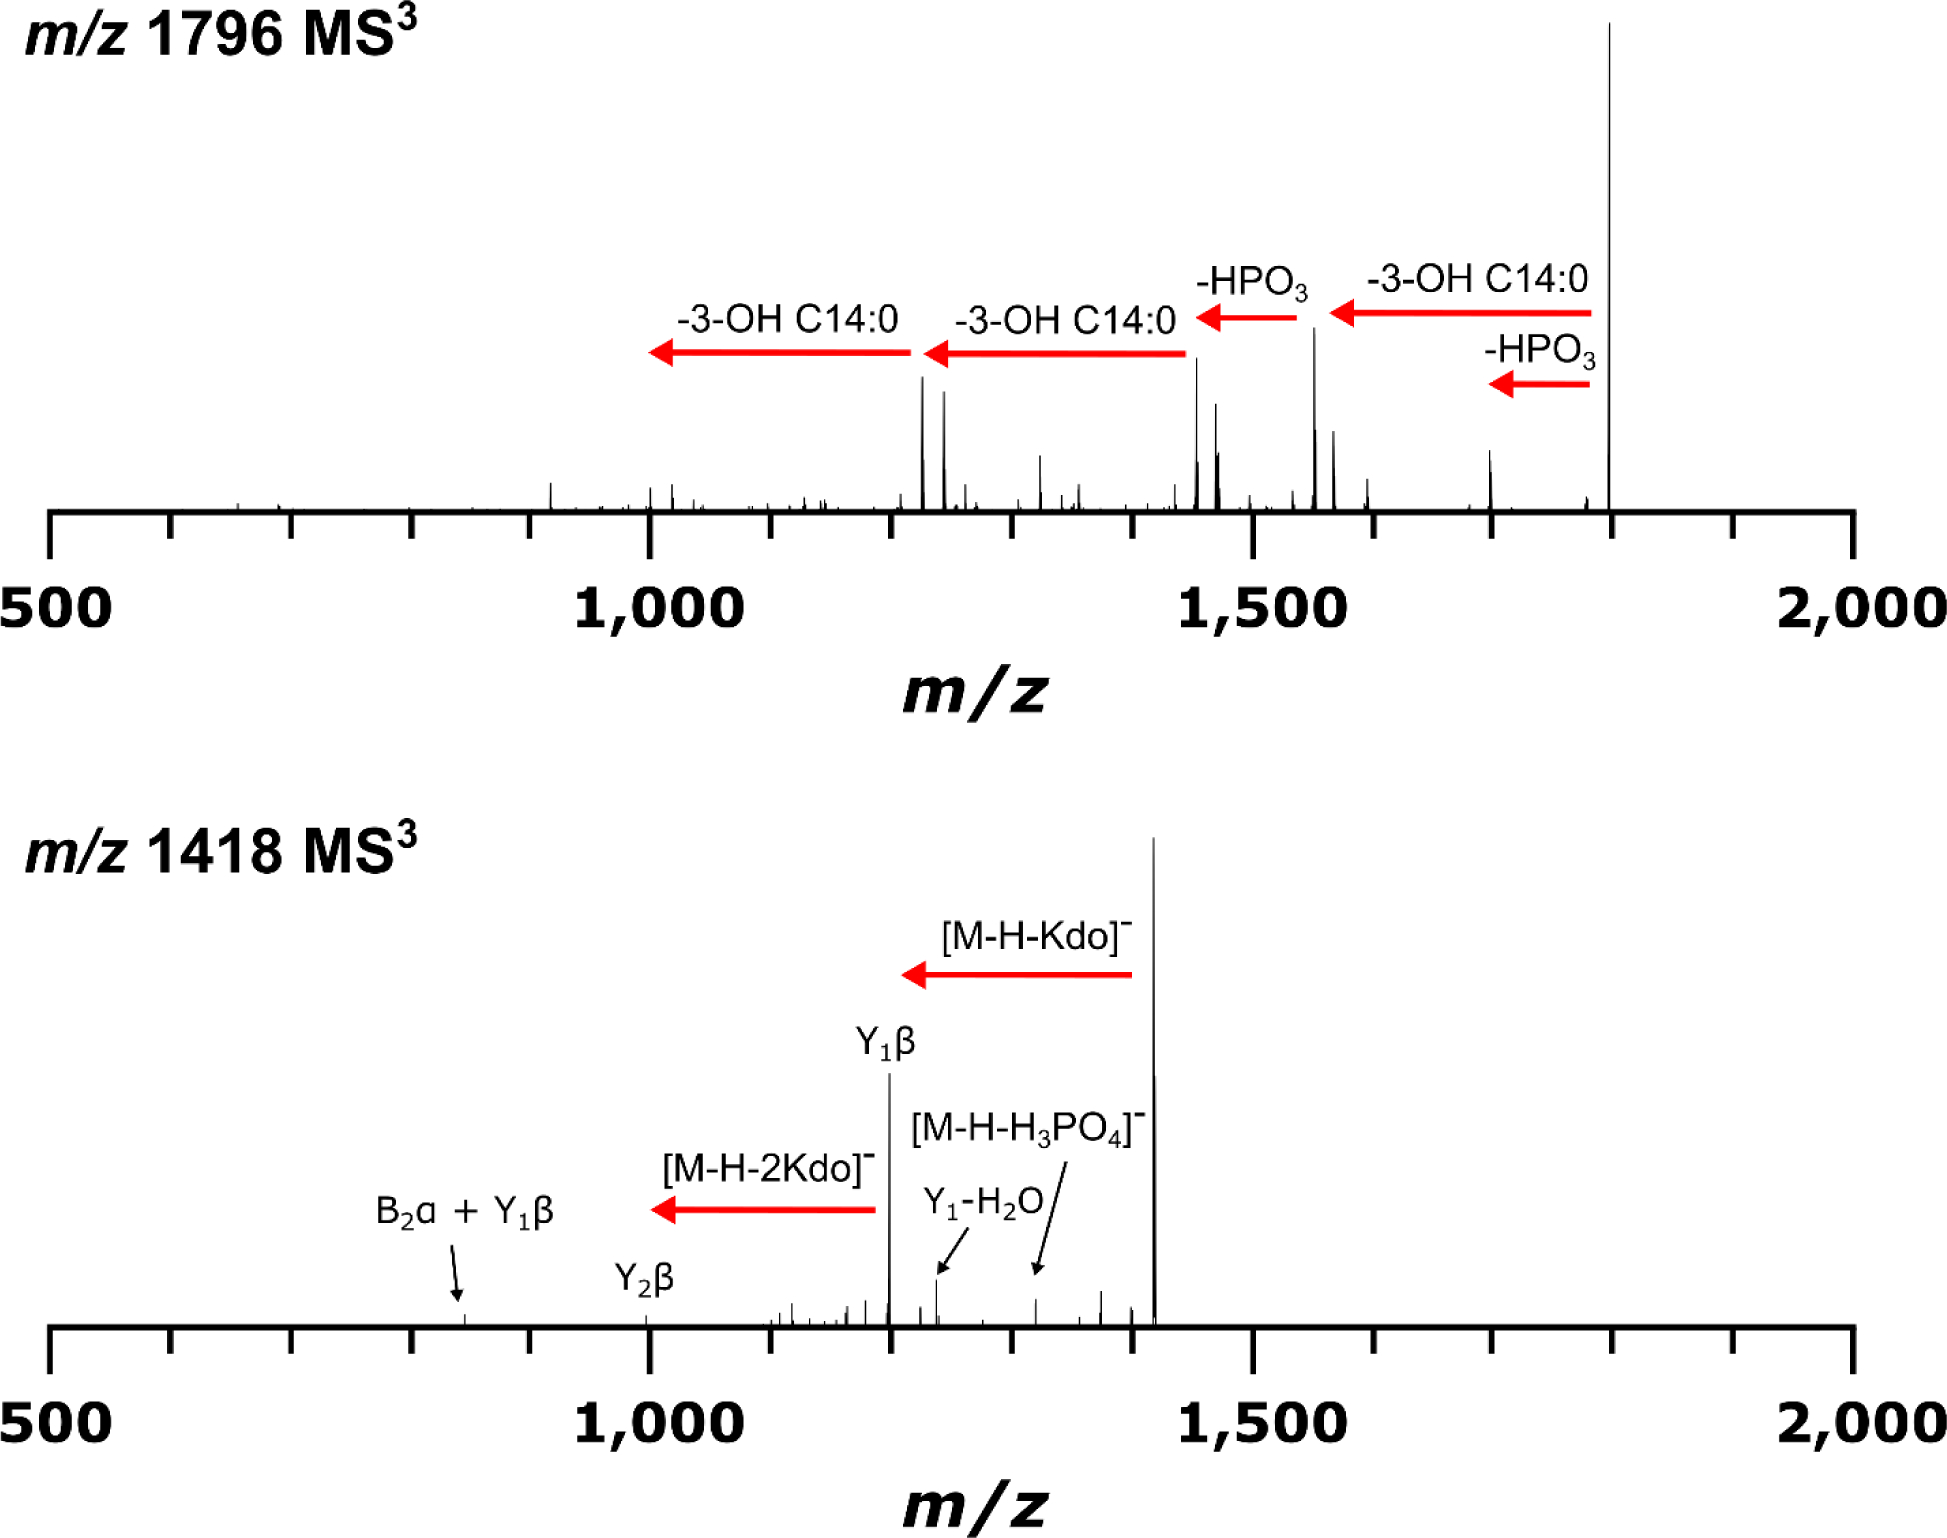
MS3 CID mass spectra from MS2 product ions representing J5 E. coli lipid A at m/z 1796 (top) and core OS at m/z 1418 (bottom). Similar dissociation phenomena were observed as in MS2 experiments for chemically isolated lipid A and oligosaccharides, indicating feasibility of LPS top down sequencing in this manner