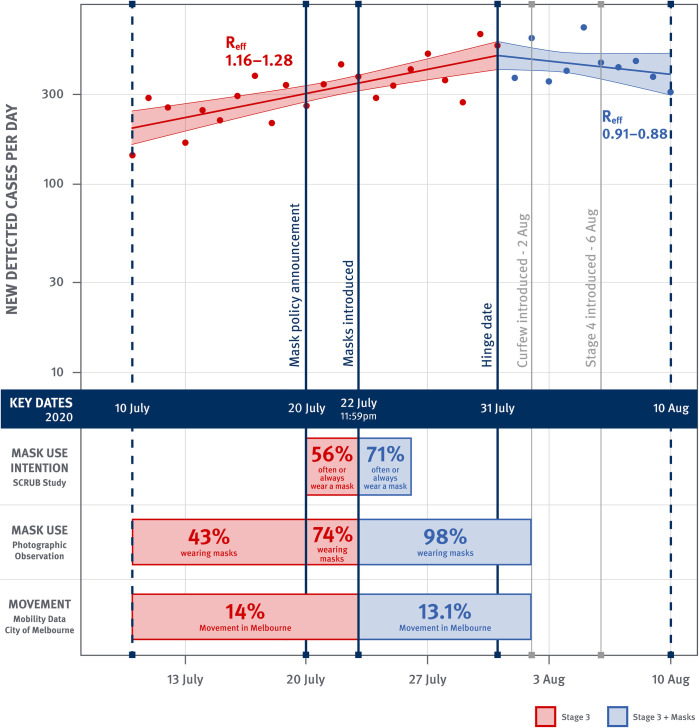
Fig 1. COVID-19 cases detected per day in Victoria.
Observed daily cases (dots) and fitted linear spline model with a hinge day on 31st July, with shading representing upper and lower 95% confidence interval of the fitted curves. Red: analysis period for pre-masks; Blue: analysis period for post-masks.

