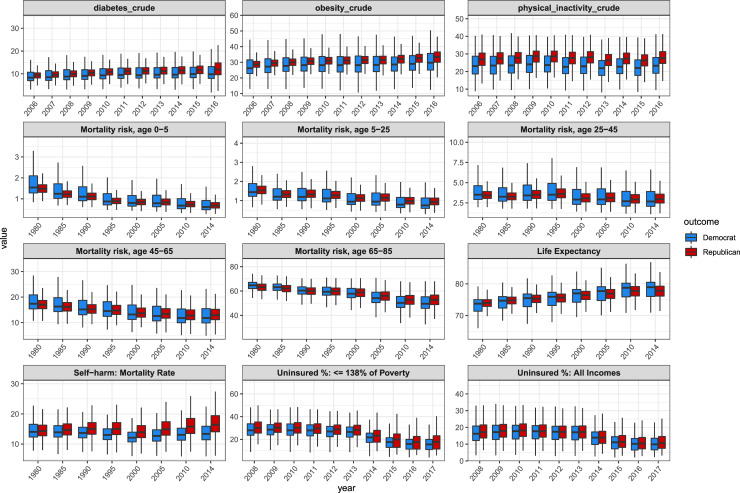
Fig 2. Boxplots comparing Democratic and Republican counties (defined by 2016 presidential election voting) over time for a number of public health variables.
For diabetes, obesity, and physical inactivity, there has been a growing divide between Republican and Democratic counties between 2006 and 2016. For mortality risk across every age group, Democratic counties have improved more than Republican counties over the time period from 1980 to 2014.

