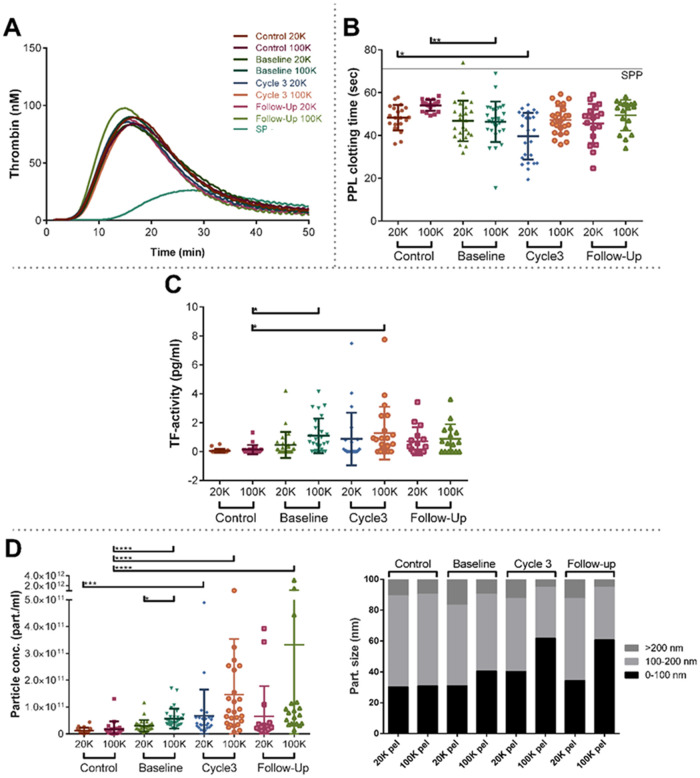
Fig 2. Procoagulant profiling of EVs isolated from healthy age-related controls and SCLC patients at baseline, during (prior to cycle 3) and after treatment (follow-up).
A) Thrombin generation curves from standard plasma (SP) and SP-containing vesicles isolated from patients and controls. B) EV-associated activity of procoagulant phospholipids (PPL) depicted as a clotting time. In both A) and B) SP represents the coagulation activity of the standard pooled plasma into which the isolated vesicles have been added. C) difference in tissue factor (TF) activity associated with EVs D) concentration and size distribution of isolated vesicles in both pellet types i.e. 20K pel and 100K pel.

