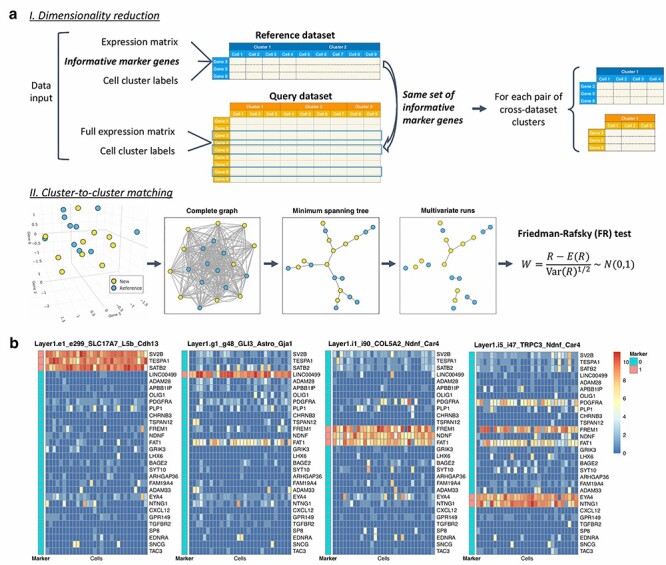
Figure 1 .

FR-Match schematic and marker gene ‘barcodes’. (a) FR-Match cluster-to-cluster matching schematic diagram. Input data: query/new and reference datasets, each with cell-by-gene expression matrix and cell cluster membership labels. Step I: dimensionality reduction by selecting expression data of reference cell type marker genes from the query dataset. Here, we use the NS-Forest marker genes selected for the reference cell types. Step II: Cluster-to-cluster matching through the FR test. From left to right: multivariate data points of cell transcriptional profiles (colored by cell cluster labels) in a reduced dimensional (reference marker gene expression) space; construct a complete graph by connecting each pair of vertices (i.e. cells); find the minimum spanning tree that connects all vertices with minimal summed edge lengths; remove the edges that connect vertices from different clusters; count the number of disjoint subgraphs, termed ‘multivariate runs’ and denoted as  ; calculate the FR statistic
  , which has asymptotically a standard normal distribution. (b) ‘Barcodes’ of the cortical Layer 1 NS-Forest marker genes in four Layer 1 clusters. Heatmaps show marker gene expression levels of 30 randomly selected cells in each cell cluster. The ‘Marker’ column indicates if the gene is a marker gene of the cluster or not (1 = yes, 0 = no).
