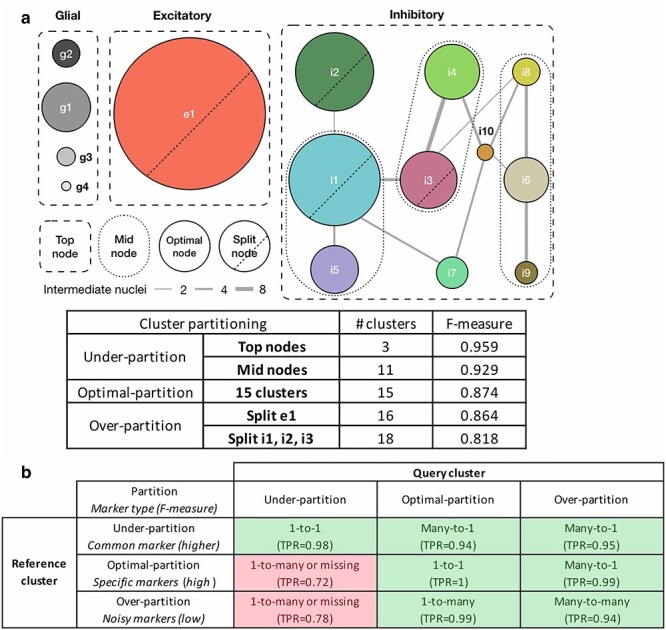
Figure 4 .

Design of the under-, optimally- and over-partitioned cluster simulations and their matching properties. (a) A schematic of simulating cluster partitions. The optimal partitioning produced nodes where cells were consistently co-clustered across 100 bootstrap iterations for clustering and curated by domain expert knowledge [13, 28]. Connectivity (edge width) between nodes is measured by the number of intermediate cells/nuclei shared by similar nodes. Two under-partition scenarios, ‘Mid nodes’ and ‘Top nodes’, were simulated by merging similar/hierarchically connected nodes (e.g. i1 + i5 clusters and all inhibitory clusters, respectively). Two over-partition scenarios, split e1 and split i1, i2 and i3, were simulated by splitting those large size clusters by k-means clustering with k = 2. Median F-measure of the NS-Forest marker genes for each partition is reported in the table. (b) FR-Match properties and expected marker gene types with respect to under-, optimally- and over-partitioned reference and query cluster scenarios, summarized from the simulation results (Supplementary Figure S11). Green blocks in the table are cases with high TPR; red blocks are warning cases with low TPR.
