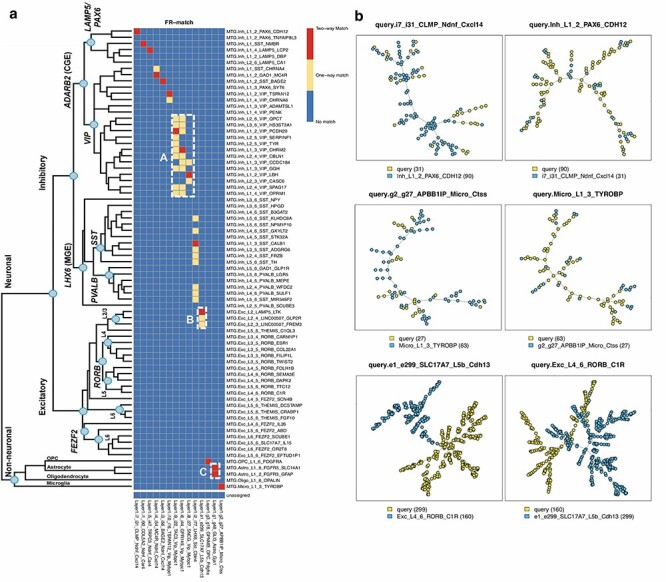
Figure 5 .

FR-Match results for cell type matching between the cortical Layer 1 and full MTG datasets. (a) Two-way matching results are shown in three colors: red indicates that a pair of clusters are matched in both directions (Layer 1 query to MTG reference with MTG markers, and MTG query to Layer 1 reference with Layer 1 markers); yellow indicates that a pair of clusters are matched in only one direction and blue indicates that a pair of clusters are not matched. The hierarchical taxonomy of the full MTG clusters is from the original study [29]. FR-Match produced 13 unique, and two non-unique two-way matches between the two datasets. Box A shows densely located one-way matches in the subclade of VIP-expressing clusters. Box B shows incidentally captured cells from upper cortical Layer 2 mixed in the Layer 1 e1 cluster. Box C shows the non-unique two-way matches of astrocyte clusters. (b) Examples of matched and unmatched minimum spanning tree plots from the FR-Match graphical tool. Top row: examples of two-way matched inhibitory clusters. Middle row: examples of two-way matched non-neuronal clusters. Bottom row: examples of unmatched excitatory clusters from different layers. Legend: cluster name (cluster size).
