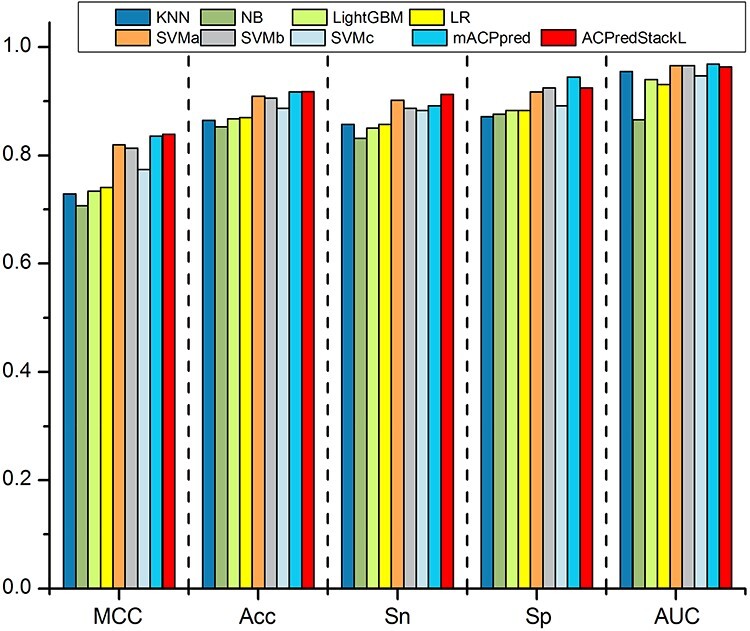
Figure 4 .

10-fold cross validation test on the benchmark dataset. Note that the values on the y axis represent performance scores of evaluation metrics.

10-fold cross validation test on the benchmark dataset. Note that the values on the y axis represent performance scores of evaluation metrics.