Figure 3 .

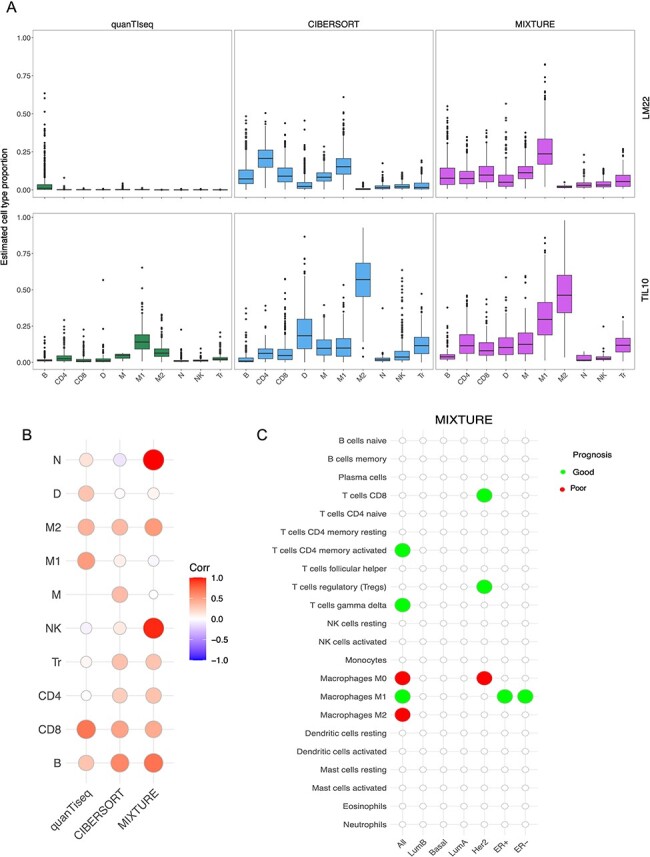
MIXTURE reveals the importance of the ITME in prognosis of breast cancer patients. (A) The TCGA-BRCA cohort classified by the PBCMC algorithm excluding the Not assigned and the Normal like subtype (n = 703) was analyzed. The estimated cell type proportions distribution (Y-axis) for each of the 10 cell types (X-axis) of the LM22 signature (upper panel) and TIL10 signatures (lower panel) are shown. The LM22 cell types where collapsed in order to match the TIL10 10 cell types (Supplementary Table 2). (B) Correlation matrix where red = 1.0 shows the highest correlation and blue = −1.0 shows the lowest correlation between the estimated cell type proportions by using LM22 and TIL10 signature matrices. (C) Cox regression analysis shows the association of each cell type proportion estimated by MIXTURE with patient prognosis for each molecular subtype using the LM22 signature. Green and red circles represent association with good and poor survival, respectively. TIL10 signature matrix: B = B cells, CD4 = CD4 T cells, CD8 = CD8 T cells, D = Dendritic cells, M1 = M1 Macrophages, M2 = M2 Macrophages, Mo = Monocytes, N = Neutrophils, NK = Natural killer cells and Tr = regulatory T cells.
